EELS Measurement of Niobium (Nb) - Practical Electron Microscopy and Database - - An Online Book - |
|||||||||||
| Microanalysis | EM Book http://www.globalsino.com/EM/ | |||||||||||
Table 3421. Main edges of Nb used in EELS analysis.
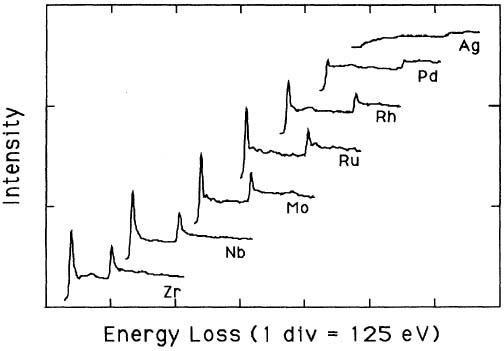
Pearson et al. [1] experimentally and theoretically (based on one-electron Hartree-Slater calculations) found that the intensities of L2,3 white lines for most of the 3d and 4d transition metals decreased nearly linearly with increasing atomic number, reflecting the filling of the d states. Figure 3421a shows the deconvoluted and background-subtracted L2,3 energy-loss spectra for the 4d transition metals. The edge energies are not shown in order to present all the spectra on the same figure, while the intensities of the white lines are scaled simultaneously for all elements.
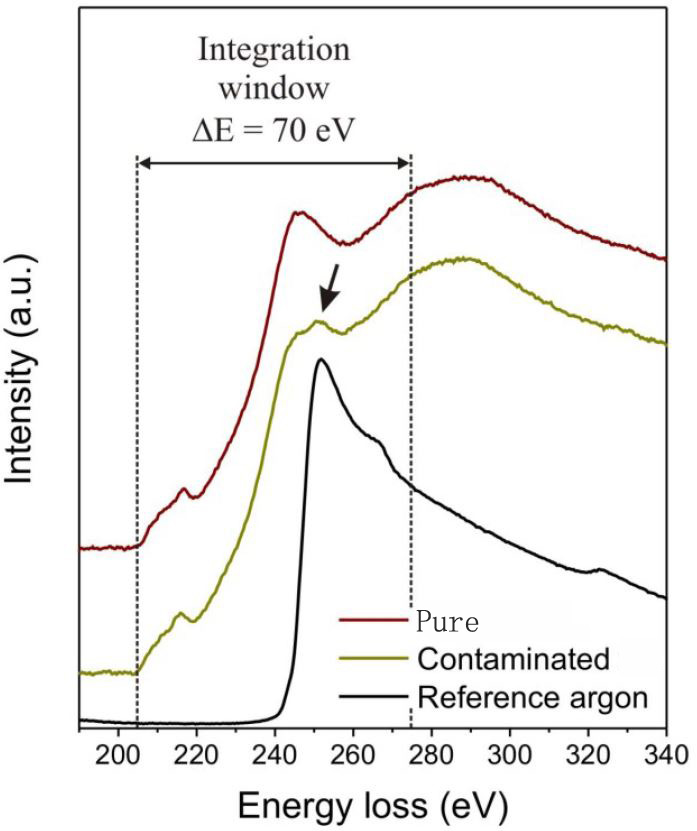
Figure 3421b shows two EEL spectra taken from a Ar-contaminated NbOx layer and a pure NbOx layer. The TEM sample with a Ar-contaminated NbOx layer is prepared by Ar+milling. An argon reference EEL spectrum is also shown. The experimental spectra are presented after background subtraction under the Nb-M4,5 edges and correction for multiple scattering.
[1] D. H. Pearson, C. C. Ahn, and B.Fultz, White lines and d-electron occupancies for the 3d and 4d transition metals, Physical Review B, 47(14), (1993) 8471-8478.
|
|
||||||||||