Chapter/Index: Introduction | A | B | C | D | E | F | G | H | I | J | K | L | M | N | O | P | Q | R | S | T | U | V | W | X | Y | Z | Appendix
| Electron energy-loss spectroscopy (EELS) examines the energy distribution of electrons after they interact with a specimen. EELS is a direct result of the Coulombic interaction of an incident, fast, nearly monochromatic electron beam with atoms in a solid. When electrons pass through a TEM sample, some incident electrons are getting inelastically scattered and results in both energy loss and a change in momentum. These energy losses are characteristic for the elements in the TEM sample. Low-energy electrons (100–1000 eV) may interact with just a few atomic layers, requiring ultrahigh vacuum due to low penetration depth. A monochromator can reduce the primary beam's energy spread to a few millielectron volts, revealing vibrational modes and valence electron excitations. Transmission EELS is typically conducted using a TEM, which also provides imaging and diffraction capabilities. Surface sensitivity at higher energies is achieved when electrons arrive at a glancing angle, causing shallow penetration. High-energy electrons can be transmitted through thin specimens (less than 1 μm, ideally below 100 nm), revealing internal structure via a spectrometer. A typical EEL spectrum contains zero energy loss peak, low energy lose and core energy loss regions. Zero energy loss peak is formed by elastically scattered electrons with zero energy loss and the incident electrons that do not interact with the sample. Low energy loss region is formed by electrons with low energy losses, which can provide information on sample optical properties. Core energy loss region is formed by electrons with energy losses by ionization of core shells, which can provide information on elemental composition and concentration, as well as bonding/valence state. The interactions of the accelerated incident electrons with the specimen result in excitations of electrons into unoccupied energy levels in the conduction band as well as collective excitations of valence electrons. Figure 4780a shows the energy loss of incident electrons as well as generation of secondary electrons (SEs) after they interact with the electrons in subshells of atoms in a TEM specimen. ΔE1 and ΔE2 represent the energy losses of the incident electrons after interaction with the electrons in the K and L3 subshells, respectively. EKE1 and EKE2 represent the kinetic energies of the two generated SEs. The kinetic energy of the generated SEs is normally in the range of 0 to 50 eV. E1 and E2 are the binding energies of the two electrons. E0 is the energy of the incident electrons in the EMs.
Figure 4780a. The energy loss (ΔE1 and ΔE2) of incident electrons as well as generation of secondary Because EELS can be combined
with transmission electron imaging, electron diffraction and energy dispersive x-ray spectroscopy, all in the same instrument, this
method has become very important for studying the physics and
chemistry of materials. EELS carried out in a TEM is capable of very high spatial resolution because of the small electron probe. EEL spectrometers can be either integrated
in the TEM column [2 - 5] or attached
to the bottom of the column [6 - 7]. An energy-loss spectrum consists of three different groups of spectral peaks: Figure 4780b shows a schematic illustration of an EELS profile on a logarithmic scale. Figure 4780c shows the schematic illustration of an energy-loss spectrum and the formation of the main energy-loss peaks related to the energy levels of electrons surrounding atom A and atom B in materials. Inelastic scattering from outer-shell electrons is visible as plasmon peak(s) in the EELS spectrum range of 2 – 50 eV. The ionization edges induced by inner-shell excitation represents ionization threshold and reflects the inner-shell binding energy. Note that typical energy loss in EELS profiles is less than 1 kV.
Figure 4780b. Schematic illustration of an EELS profile on a logarithmic scale.
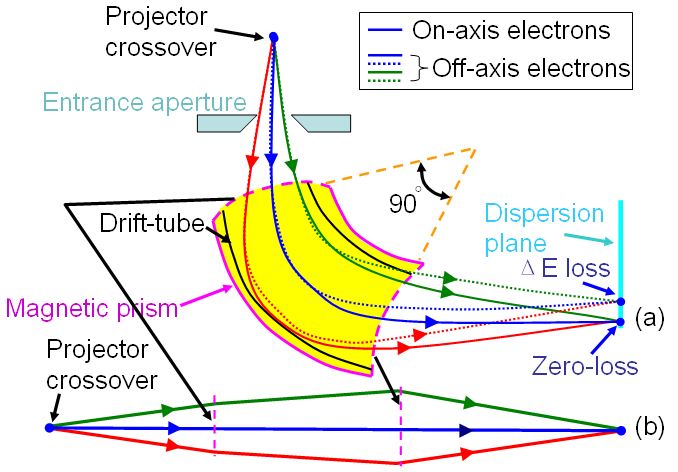
Figure 4780c. Schematic illustration of an energy-loss spectrum and the formation of three main energy-loss peaks. Electron energy loss spectroscopy (EELS) measures the spectral distribution of energy transferred from an incident electron beam into a specimen. In general, there are mainly two types of fundamental methods: EELS is related to electronic, optical and mechanical properties of the observed materials. Methods i) and ii) above are also called reflection electron energy loss spectroscopy (REELS) and transmission electron energy loss spectroscopy (TEELS) modes, respectively. However, different from REELS, the name of TEELS is conventionally simplified as EELS. Only electrons scattered at small angles and without loosing energies will contribute to the information in the HRTEM images while all the others (which have lost energy and have been scattered multiple times or at high angles) also contains important information about the sample, they will for instance give a diffuse background in the TEM images and benefit to EFTEM elemental mapping and EELS measurements. Simply speaking, inelastic scattering mainly involves electron-electron interactions and is mainly applied for analytical analyses such as EELS (electron energy loss spectroscopy) or EDS (energy dispersive X-ray spectrum) analysis. Therefore, a method to obtain information carried by inelastically scattered electrons is to use electron energy-loss spectroscopy (EELS). In principle, there are number of ways in which the incident electrons interact elastically with the specimen, giving rise to various features in the energy loss detected by EELS method. The EELS Section in this book provides an overview of EELS instrumentation, of chemistry included in chemical bonding, and of the physics involved in the scattering of energetic electrons in solids. Characteristics of the energy-loss spectrum are discussed, including plasmon peaks, inner-shell ionization edges, and fine structure related to the electronic densities of states. Examples are given of the use of EELS for the measurement of local properties, including specimen thickness, optical, mechanical and electronic properties (such as bandgap) and chemical composition. Factors that determine the spatial resolution of the analysis are reviewed, including radiation damage to the specimen. Much of the spectral information obtainable from EELS is similar to that given by synchrotron-XAS (x-ray absorption spectroscopy), so that EELS in TEM has been referred to as a synchrotron in electron microscopes [1]. Because the incident, high-energy electrons are transmitted through the TEM specimen, EELS is not surface sensitive, making it a technique for bulk density of states measurements. EELS measures the distribution of energies lost by incident electrons (typically 100–1000 keV) as they pass through a thin solid specimen (typically 0.5–50 nm). Among all the spectroscopy techniques, most early core excitation spectroscopy applied to polymer, particularly at the C 1s core edge, had been performed by EEL spectroscopy. Practically, EELS analysis is much easier and probably more accurate if the core-loss edges of the elements in the specimen are well separated in energy. For the case with a GIF system in Figure 4780d (a), the spectrum is formed in the dispersion plane, consisting of a distribution of electron counts (I) versus energy loss (ΔE). All the electrons suffering the same energy loss but traveling in both on-axis and off-axis directions are directed to a focus in the dispersion plane of the spectrometer, which acts as a homogenous magnetic lens as shown in the equivalent schematics in Figure 4780d (b). The object plane of the spectrometer is typically set at the back focal plane (crossover) of the projector lens.
[1] Brown L M 1997 A synchrotron in a microscope Proc. EMAG97
(Cambridge) (Inst. Phys. Conf. Ser. 153) pp 17–21.
|