|
This book (Practical Electron Microscopy and Database) is a reference for TEM and SEM students, operators, engineers, technicians, managers, and researchers.
|
=================================================================================
Figure 3601a shows typical Ronchigrams taken at the edge of an amorphous carbon film. At defoci (defined by z-height), there is a distance between the electron cross-over and the point on the specimen along the optic axis. At large underfocus, electron rays at all angles cross the optic axis after the specimen and it shows a shadow image of the specimen edge. At small underfocus, low-angle rays cross the optic axis after the specimen, while high-angle rays cross before the specimen due to spherical aberration. Therefore, the shadow image changes in magnification as a function of the angle. The low-angle asymmetry indicates the presence of astigmatism. At Gaussian focus, the lowest-angle rays cross the axis at the specimen, while higher-angle rays cross before the specimen due to the spherical aberration. The coma free axis is defined at this focus and all alignment and positioning of detectors and apertures can be performed with respect to the low-angle “disk”. Defocus and spherical aberration can effectively cancel each other at those lowest angles. Axial astigmatism can be accurately corrected by using the stigmator coils, resulting in circularly symmetric Ronchigram features. At overfocus, rays at all angles cross the axis before the specimen.
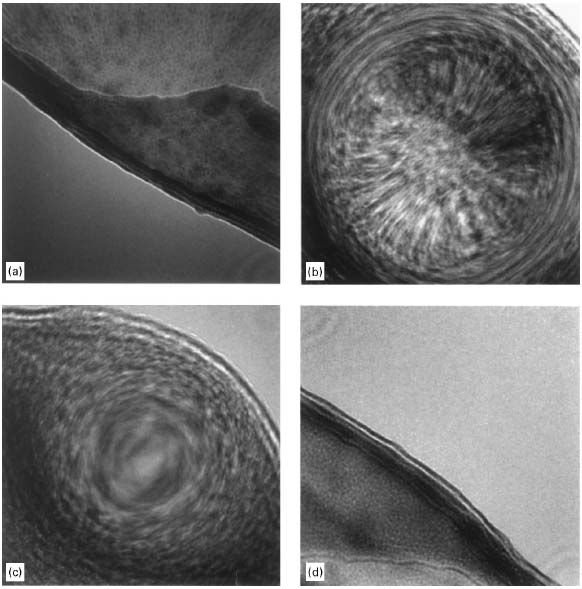
Figure 3601a. Ronchigrams of a thin amorphous carbon (C) film at: (a) Large underfocus, (b) Small underfocus, (c) Gaussian focus, and (d) Overfocus.
[1]
Figure 3601b shows examples of simulated intensity distribution of Ronchigrams (See theory and concepts at page3590) obtained with a slightly incoherent electron probe and a spherical aberration of 10 µm, at a defocus of -70 nm.
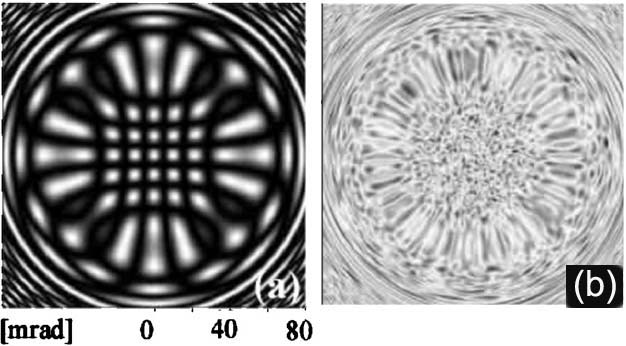
Figure 3601b. Simulated Ronchigrams with a spherical aberration of 10 µm and a defocus of -70 nm: (a) For lattice 0.7 nm lattice specimen and (b) For amorphous foil specimen.
Adapted from [2]
[1] E.M. James, N.D. Browning, Practical aspects of atomic resolution imaging and analysis in STEM, Ultramicroscopy 78 (1999) 125-139.
[2] Sawada H, Sannomiya T, Hosokawa F, Nakamichi T, Kaneyama T, Tomita T, Kondo Y, Tanaka T, Oshima Y, Tanishiro Y, and Takayanagi K (2008) Measurement method of aberration from Ronchigram by autocorrelation function. Ultramicroscopy 108: 1467–1475.
|