Many methods, after stripping the background of the core-loss, deconvolute the core-loss region of the spectrum with the low-loss region, thus removing the effects of multiple scattering. These procedures, in fact, ignore the different "angular collection efficiencies" associated with plural and single scattering. [14]
Deconvolution and fit of EEL spectra are widely used for removing spectrum background, separating the spectra generated from different elements, and removing artifacts in EELS signal:
i) Numerous background subtraction techniques have been
proposed to extract EELS signals. However, their use depends on the shape of the EELS-spectrum
and/or the energy of the edge under consideration. Power-law fit is applicable to most ionization edges.
ii) Deconvolution consists of estimating Oi(E)for each element i in the materials. In general, we can view the observed EEL spectrum I(E) as
 ------------------------------ [3936] ------------------------------ [3936]
where,
O(E) -- The single scattering EELS spectrum (SSD),
P(E) -- The point spread function (PSF) including multiple scattering and instru-
mental broadening,
N(E) -- The additive noise.
Tables 3936a and 3936b show common methods for such deconvolution and background fit functions. Some are ‘smart’ algorithms to address some particular problems in specific cases in background fit and edge deconvolution.
Table 3936a. Techniques used for EEL spectrum background fit.
| Techniques |
Characteristics |
| Power-law fit |
Most common and simplest background fit technique. Remove EELS background by fitting in a region preceding the excitation edge. Applicable to most ionization edges (note: does not work on low energy edges) |
Exponential fit
|
Fit to low energy loss regions at moderate thicknesses, e.g. for background subtraction under
the Nb-M2,3 edges which is complicated by the intense tail of the
preceding Nb-M4,5 edges.[12] Works without the assurance that the energy dependency of the background does not vary under the
edge. |
Experimental background fit
|
Use an experimental spectrum as a reference to extract the background of other similar spectra, [13] it is used when no other better choice is available. |
| Four window method |
To remove background for elemental mapping with overlapping or closely spaced ionization edges, e.g. to map Cr with the L2,3-edge in oxidized specimens [10] |
| Linear fit |
Fits over small energy window when edges
overlap |
| (Log)-polynomial
function |
Fit background, e.g. for background subtraction under
the Nb-M2,3 edges which is complicated by the intense tail of the
preceding Nb-M4,5 edges.[12] It is used when no other better choice is available. Works without the assurance that the energy dependency of the background does not vary under the
edge. |
| Differentiation |
Record two spectra with small relative shift along the energy axis, and then obtain the difference of the two spectra |
| Multivariate statistics
approaches |
|
| Third-order polynomial |
Remove EELS background: work on edges below the
Fe M2,3-edge (49 eV) [9] |
Table 3936b. Techniques used for EEL spectrum deconvolution.
| Techniques |
Characteristics |
Fourier ratio method
|
Remove plural inelastic scattering contributions [11], and it is a high-frequency enhancement technique, then high-frequency noise in the core-loss spectrum is substantially amplified |
| Fourier-log deconvolution |
Remove multiple-scattering artifacts |
| Fourier techniques |
Multiple scattering deconvolution |
| Multiple linear least-squares (MLLS) fitting |
Deconvolute overlap of edges, e.g. O K and Cr L2,3 [8] |
| MLLS fitting and k-means clustering |
|
| Straightforward deconvolution |
Very limited application [11] |
| Gaussian modifier |
Deconvolution by damping the higher frequencies with a Gaussian function |
| Wiener filter |
|
| Maximum-entropy (ME) |
Not significantly affected by high-frequency noise |
| Richardson–Lucy (RL) algorithms |
Not significantly affected by high-frequency noise |
| Singular
value decomposition (SVD) |
E.g. used for the MLLS fit routine
implemented in the DM software |
In order to improve the energy resolution of EEL spectrum, before spectrum deconvolution, scripts (e.g. applied in Gatan Digital Micrograph) can be used to automatically acquire and store each spectrum separately, and then to evaluate and correct the energy drift in each acquisition. [1, 2] After the drift correction, the EEL spectrum can be deconvoluted using software. For instance, some deconvolution techniques are Fourier ratio method, maximum-entropy (ME) [3,4] and Richardson–Lucy (RL) algorithms [5]. In the Fourier ratio method, the "ideal" core-loss spectrum is obtained by inverse Fourier transform. Since the Fourier ratio deconvolution is a high-frequency enhancement technique, high-frequency noise in the core-loss spectrum is substantially amplified. The ME and RL algorithms estimate a predicted spectrum by convoluting it with an observed low-loss spectrum, and thus they are not so significantly affected by high-frequency noise as compared with the Fourier ratio deconvolution technique.
For thick TEM specimens, an incident electron that has undergone inner-shell scattering can also cause outer-shell excitation with very high probability. This mixed inelastic scatterings is the sum of both inner-shell and outer-shell scatterings, resulting in a mixed energy loss and a peak broadening (plasmon behavior) above the ionization threshold. If necessary, this outer-shell scattering intensity can be removed from the spectrum by deconvolution.
In general, if the TEM specimen is too thick (t/λ > 0.4), a deconvolution process must be employed to remove the effect of plural scattering, since the increase of plural scattering intensity in the higher energy region of an ionization edge can cause some artifacts:
i) Mask the fine structure;
ii) Make the background signal on subsequent edges deviate significantly from the power law model.
In this case, in order to deconvolute the core-loss spectrum, the Fourier-ratio method is applied. The deconvolution procedures then are:
i) Collect both the low- and core-loss spectra from the same region of the specimen under the same conditions (including eV/change, convergence and collection semiangles).
ii) Isolate the edge of interest and remove the background intensity.
iii) Fourier-transfer the low-loss spectrum and background-subtracted edge.
iv) Divide the core-loss spectrum Fourier transform by the low-loss Fourier transform.
v) Inverse the Fourier transform to yield the desired deconvolved spectrum.
However, in most cases, recording low-loss and core-loss spectra under the same conditions is extremely challenging, since the acquisiton time required for a good SNR (signal to noise ratio) in the core-loss spectrum is usually not short enough to avoid saturation of the signal from the ZLP. Therefore, in practice, it is necessary to sacrifice the SNR in the core-loss signal, or utilize a spectrometer system that has an ultrafast electrostatic shutter installed.
The low loss region in Figure 3936 shows the overlap between Fe-M edge and Li-K edge in an EEL spectrum taken from discharged FeOF materials in a Li-ion battery. The extracted Li-K edge was obtained by deconvolution technique.
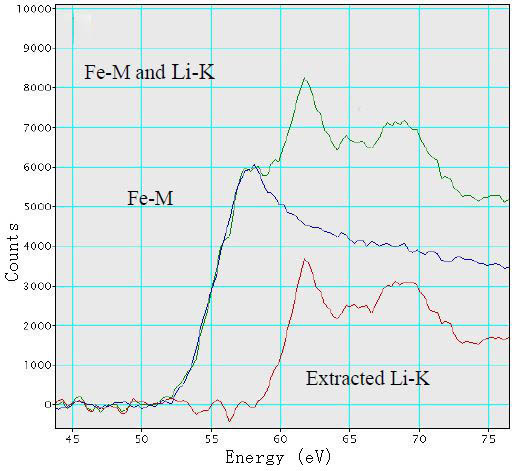
| Figure 3936. EEL spectrum taken from discharged FeOF materials in a Li-ion battery. Adapted from [6] |
[1] Kimoto K and Matsui Y (2002) Software techniques for EELS to realize
about 0.3 eV energy resolution using 300 kV FEG-TEM. J. Microsc.
208: 224–228.
[2] Koji Kimoto, Kazuo Ishizuka, Teruyasu Mizoguchi, Isao Tanaka and Yoshio Matsui, The study of Al-L23 ELNES with resolution-enhancement software and first-principles calculation, Journal of Electron Microscopy 52(3): 299–303 (2003).
[3] Kuzuo R and Tanaka M (1993) Resolution enhancement of electron
energy-loss spectra using the maximum entropy method. J. Electron
Microsc. 42: 240–243.
[4] Overwijk M H F and Reefman D (2000) Maximum-entropy deconvolution
applied to electron energy-loss spectroscopy. Micron 31: 325–331.
[5] Gloter A, Douiri A, Tencé M, Imhoff D, and Colliex C (2002) Improving
energy resolution of EELS spectra: an alternative to the monochromator
solution. In: Proc. of 15th ICEM, Durban, South Africa, pp. 141–142.
[6] F. Cosandey, Analysis of Li-Ion Battery Materials by Electron Energy Loss Spectroscopy, Microscopy: Science, Technology, Applications and Education, A. Méndez-Vilas and J. Díaz (Eds.), 1662, (2010).
[7] P. Rez, Detection limits and error analysis in energy loss spectrometry. Microbeam
Analysis (p. 153). San Francisco Press, (1983).
[8] Katharina Riegler, and Gerald Kothleitner, EELS detection limits revisited: Ruby — a case study, Ultramicroscopy 110, 1004–1013, (2010).
[9] A. Haking, H. Troester, K. Richter, C. Crucifix, H. Spring, and M.F. Tren-
delenburg, “An approach to an objective background subtraction for elemental mapping with core-eges down to 50 eV: description, evaluation and application,”
Ultramicroscopy 80, 163–182 (1999)..
[10] J. Bentley, “Interfacial segregation and concentration profiles by energy-filtered
transmission electron microscopy: issues and guidelines,” Microsc. Microanal.
4, Suppl. 2 Proceedings (1998) pp. 158–159.
[11] R.F. Egerton, Electron Energy-Loss Spectroscopy in the Electron Microscope,
second ed., Plenum Press, New York, London, 1996.
[12] David Bach, Reinhard Schneider, Dagmar Gerthsen, Jo Verbeeck, and Wilfried Sigle, EELS of Niobium and Stoichiometric Niobium-Oxide Phases—Part I: Plasmon and Near-Edges Fine Structure, Microsc. Microanal. 15, 505–523, 2009, doi:10.1017/S143192760999105X.
[13] Sala, Bianca, Scanning transmission electron microscopy characterisation of carbide precipitates in steel, PhD thesis, (2019).
[14] A. P. Stephens, Quantitative microanalysis by electron energy-loss spectroscopy: Two corrections, 5 (1–3) (1980), 343-349.
|