EDS Measurement of Potassium (K) - Practical Electron Microscopy and Database - - An Online Book - |
||||||||
| Microanalysis | EM Book https://www.globalsino.com/EM/ | ||||||||
| ================================================================================= | ||||||||
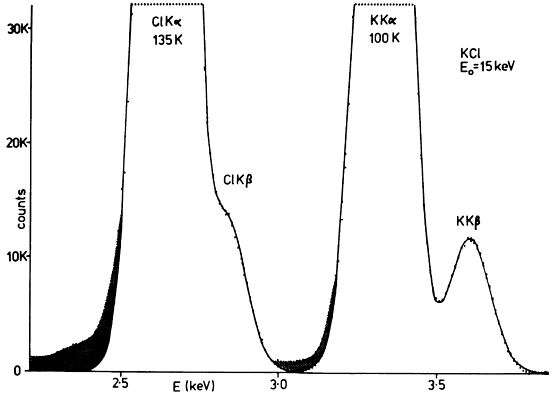
The EDS spectrum of KCl in Figure 1752 shows a peak overlap and a typical spectrum distortion induced by the incomplete charge collection. The chlorine Kα and Kβ peaks are not resolved, while the potassium Kα and Kβ are almost resolved. The solid line is a Gaussian fit to the data points. The shaded areas are two non-Gaussian low energy tails that are distortions induced by incomplete charge collection.
|
||||||||
| ================================================================================= | ||||||||
|
|
||||||||