|
This book (Practical Electron Microscopy and Database) is a reference for TEM and SEM students, operators, engineers, technicians, managers, and researchers.
|
=================================================================================
The Ronchigrams of a thin <110> silicon (Si) film in Figure 1953a shows the diffraction effects and fringes arising from the specimen periodicities. The visibility of the characteristic fringes depends on the precision of specimen tilt and the degree of probe coherence in a specific crystalline orientation. Figure 1953a (a) shows the Ronchigram at small underfocus. The lattice fringes are visible near the Ronchigram center and become extremely distorted at high angles because of the spherical aberration. Figure 1953a (b) shows the Ronchigram near Scherzer focus. The central fringes are large and wide. Figure 1953a (c) shows the Ronchigram at slight overfocus. The fringe spacing decreases with increasing angle from the Ronchigram center.
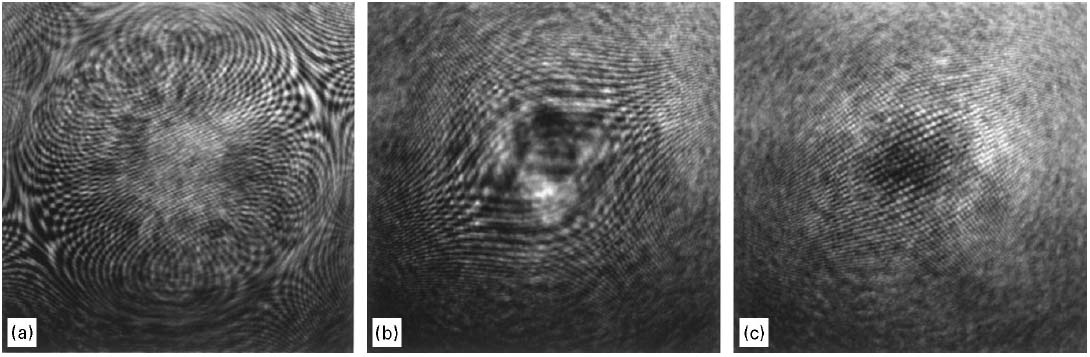
Figure 1953a. The Ronchigrams of a thin <110> Si film: (a) At small underfocus, (b) Near Scherzer focus, and (c) At slight overfocus.
[1]
Figure 1953b shows examples of simulated intensity distribution of Ronchigrams (See theory and concepts at page3590) obtained with a slightly incoherent electron probe and a spherical aberration of 10 µm, at a defocus of -70 nm.
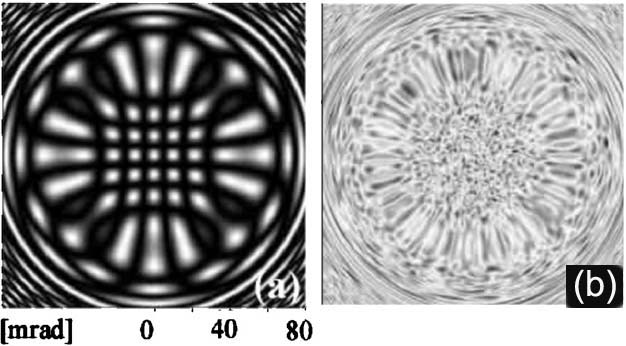
Figure 1953b. Simulated Ronchigrams with a spherical aberration of 10 µm and a defocus of -70 nm: (a) For lattice 0.7 nm lattice specimen and (b) For amorphous foil specimen.
Adapted from [2]
[1] E.M. James, N.D. Browning, Practical aspects of atomic resolution imaging and analysis in STEM, Ultramicroscopy 78 (1999) 125-139.
[2] Sawada H, Sannomiya T, Hosokawa F, Nakamichi T, Kaneyama T, Tomita T, Kondo Y, Tanaka T, Oshima Y, Tanishiro Y, and Takayanagi K (2008) Measurement method of aberration from Ronchigram by autocorrelation function. Ultramicroscopy 108: 1467–1475.
|