Gold (Au) - Practical Electron Microscopy and Database - - An Online Book - |
||||||||||||||||||||||||||||||||||||||||||||||||||||||||||
| Microanalysis | EM Book https://www.globalsino.com/EM/ | ||||||||||||||||||||||||||||||||||||||||||||||||||||||||||
Table 2027a. Properties of gold (Au).
Table 2027b. Some surface energies (J/m2) of low-index surfaces of Au crystals.
Assuming the crystalline parameters in nanoparticles are the same as those in bulk crystals, an Au nanoparticle in diameter of ~2.3 nm contains 309 atoms. Those atoms can be packed into a completed polyhedron, such as icosahedrons, ino-decahedrons or cuboctahedrons. [1] In this type of clusters, approximately 50% atoms locate at the surface. Figure 2027a shows the phase diagram of the structure of Au nanoparticles whose melting point decreases with decrease of the size of Au nanoparticles.
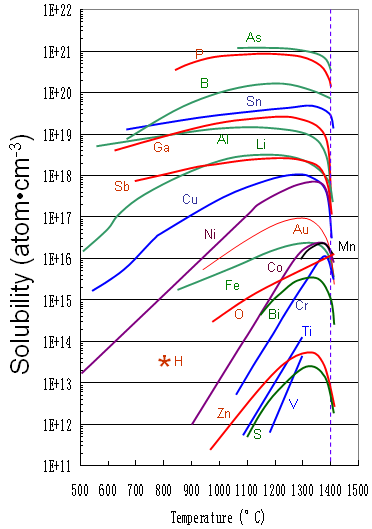
Figure 2027a. Phase diagram of the structure of Au nanoparticles. Adapted from [2] Figure 2027b shows the solid solubility of some impurities (including Au) in silicon.
Figure 2027b. Solid solubility of impurities in silicon.
Figure 2027c shows the pair distribution function (PDF, g(r)), of the fcc gold (Au) crystal, from the black (origin) atom at room temperature. The PDF peaks with atoms in different colors correspond to the atoms in the same color in the atomic structure of the inset. The numbers of first (12), second (6) and third (24) nearest atoms in the fcc Au crystal are also listed.
Figure 2027c. Pair distribution function g(r) of fcc gold (Au) at room temperature. Figure 2027d shows the radial distribution function R(r), of the fcc gold (Au) crystal, from the black (origin) atom at room temperature.
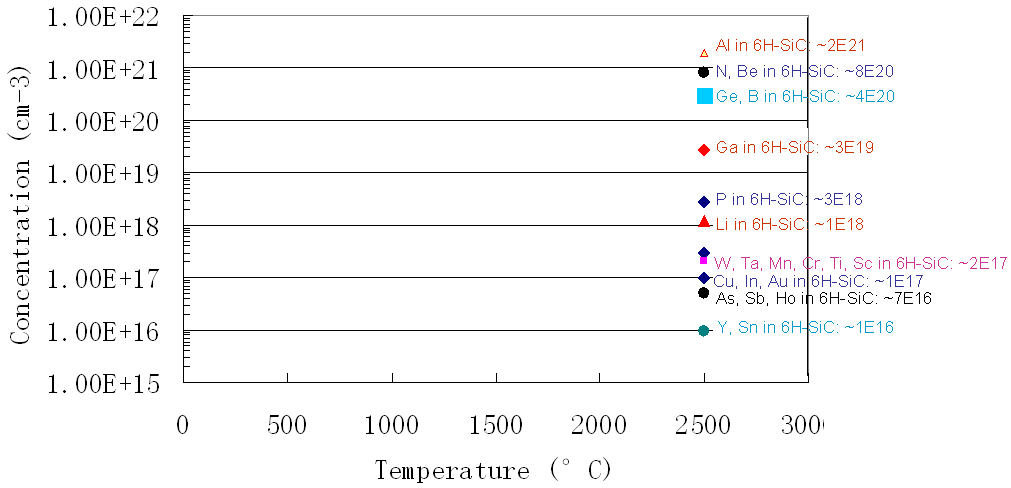
Figure 2027d. Radial distribution function R(r) of fcc gold (Au) at room temperature. Figure 2027e shows the solubility for impurities (including Au) in SiC.
Figure 2027e. Solubility for impurities in SiC.
[1] Curley BC, Johnston RL, Young NP, Li ZY, DiVece M, Palmer RE, et al. J Phys Chem C
2007;111:17846–51.
|
|
|||||||||||||||||||||||||||||||||||||||||||||||||||||||||