=================================================================================
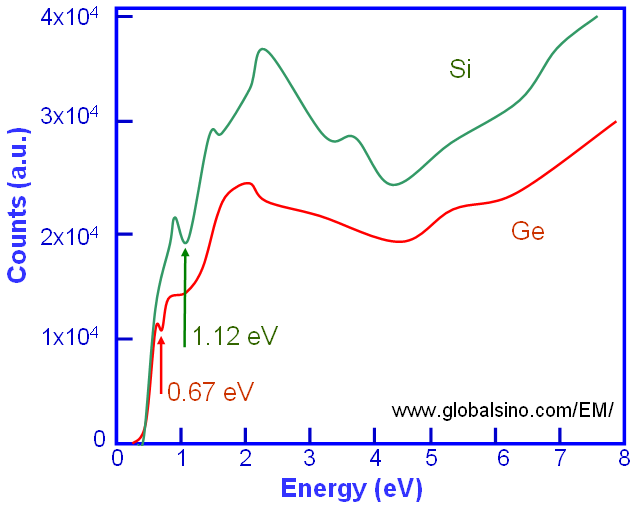
Single scattering distribution (SSD) spectra can be extracted from experimental spectra by deconvolution of elastic/quasi-elastic phonon and multiple scattering effects. For instance, this deconvolution can be done by removing multiple scattering with Fourier-log deconvolution method. For some materials (especially wide band gap materials), the band gap (Eg) from low-loss spectra obtained by EELS technique can be determined by eye observation of the SSD spectrum. In this case, Eg is defined as the energy corresponding to the first onset in the spectrum, for instance, 0.67 and 1.12 eV for Ge and Si respectively, in the schematic spectra in Figure 2403a.

Figure 2403a. Schematic illustration of Si and Ge SSD spectra in the low-energy range.
However, Ge EELS measurements for line scans and mapping are normally performed with Ge L2,3 edge (1217 eV).
|