=================================================================================
Figure 2668a shows the schematic illustration of a EFTEM system together with a TEM instrument.
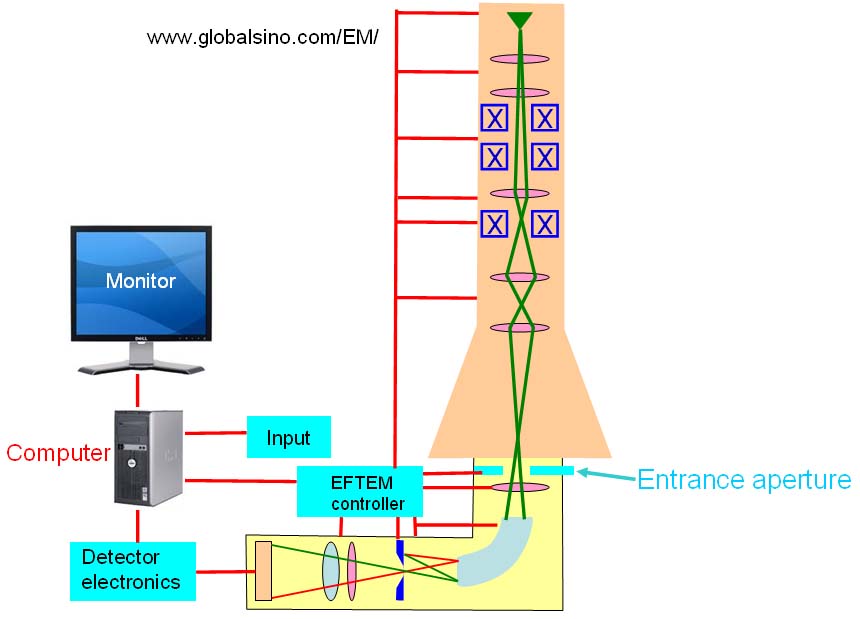
Figure 2668a. Schematic illustration of a EFTEM system together with a TEM instrument.
The entrance aperture assembly in modern TEMs is controlled by a computer to position a selected entrance aperture to intercept the electron beam or to retract the aperture fully to permit the entire beam to enter the filtering system. Note that more than one aperture size or shape is normally included in a given EFTEM system.
For the most common EFTEM unit as shown in Figure 2668b, the detection system consists of a slow scan CCD array detector rather than a single line of diodes used in PEELS detector.
Figure 2668b. Gatan imaging filter using CCD detector.
The pre-slit optics and dispersing element produce a beam intensity profile at the plane of an energy-selecting slit.
There are some methodological differences from system to system, but Figure 2668c shows an example on how the zero-loss-peak alignment is performed. If the beam-pass ratio is at least 25% (or the selected percentage), the zero loss peak of the energy loss spectrum is considered to have been aligned; otherwise, the zero-loss-peak adjustment process is needed. In this system, an upper-slit beam current detector and a lower-slit beam current detector are employed to the detection of misalignment in order to determine whether the majority of the spectrum intensity falls on the upper slit half or on the lower slit half.
Figure 2668c. An example on how the zero-loss-peak alignment is performed.
The green-boxed inset shows the configuration of the slit.
Figure 2668d presents an example of automatic procedures to correct the magnification and aspect ratio of TEM (e.g. EFTEM) images with computer control. In this process, the imaged centers of the beam intensity distribution positions of the patterned beam scan are measured and applied to the adjustment.
Figure 2668d. Example of automatic procedures to correct the magnification and aspect ratio of TEM (e.g. EFTEM) images with computer control.
Figure 2668e shows an example on how to correct the achromaticity in EFTEM mode. In this process, an energy offset is applied to the electron beam by changing the accelerating voltage at the electron gun of the TEM. The differences between the current positions of the hole centers of the mask and those measured before the change in beam energy are determined. The net average displacement is taken as a measure of the departure of the energy filtering system from the true achromatic imaging. If the net average displacement is not within the operator-specified tolerance, the effect on the average displacement to the changes in the current of a chromatic adjustment quadrupole lens of post-slit electron optics of the energy filtering system is assessed. These operations are iteratively performed if more precise achromatic adjustment is required or until the measured average displacement is within the specified tolerance.
Figure 2668e. An example on how to correct the achromaticity.
Figure 2668f shows an example of procedures of image distortion correction in FETEM.
Figure 2668f. Example of procedures of image distortion correction in FETEM.
Spectrum focus adjustment in EFTEM measurement can be done automatically with computer control. Figure 2668g shows an example of adjustment procedures.
Figure 2668g. Example of procedures of spectrum focus adjustment in EFTEM measurement.
|