EDS Measurement of Chromium (Cr) - Practical Electron Microscopy and Database - - An Online Book - |
|||||
| Microanalysis | EM Book https://www.globalsino.com/EM/ | |||||
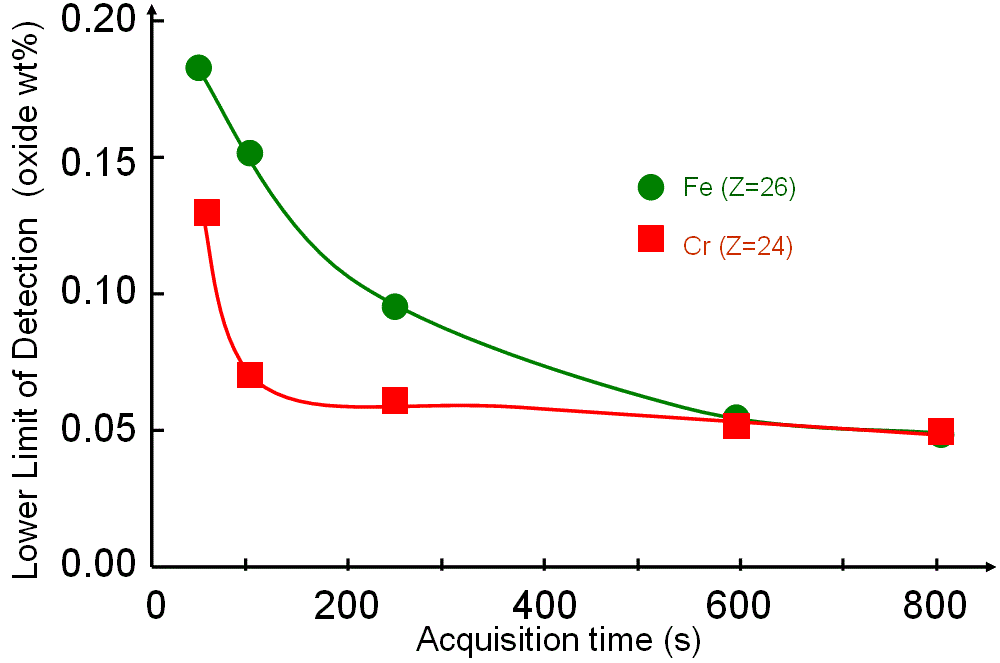
Figure 3122 shows the SEM-EDS lower limits of detection (LLD) of Cr and Fe in glass (oxide) as a function of spectrum acquisition time. The detection limits can be improved at the beginning of increasing acquisition time but cannot do with further time increase.
Figure 3122. SEM-EDS lower limits of detection of Cr and Fe in glass as a function of spectrum acquisition time (Adapted from [1]). Note that, in practice, Cr X-rays are also generated from SEM/TEM specimen chamber, column and apertures by Rutherford backscattered electrons because these parts of the SEM/TEM systems contain such element. These spurious X-rays can often be detected by the EDS detector. EDS-TEM specimen holders and stray aperture are normally used to reduce such spurious X-rays.
[1] Falcone, R., Sommariva, G. and Verita, M. (2006) WDXRF, EPMA and SEM/EDX quantitative chemical analysis of small glass samples, Microchim. Acta, 155, 137-140.
|
|
||||