=================================================================================
As shown in Figure 3355a, in TEM bright-field (BF) mode, an objective aperture is placed in the back focal plane of the objective lens which allows only the transmitted beam to pass. In this case, mass-thickness and diffraction contrast contribute to image formation, that is thick areas, areas with heavy atoms, and crystalline areas in most crystalline orientations appear in dark contrast. The mixed contrasts make the interpretation difficult.
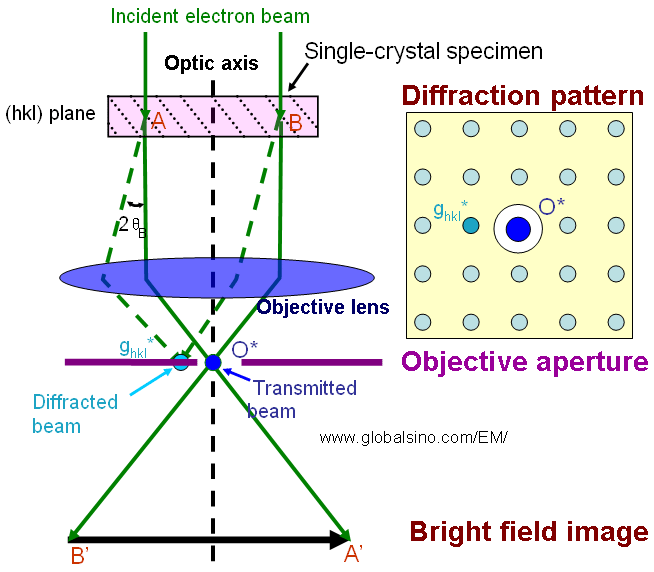
Figure 3355a. TEM bright field (BF) mode.
The local contrast on the TEM image plane is proportional to the number of electrons striking the viewing screen or detector. Objective apertures in different sizes can be selected for imaging. Figure 3355b illustrates the mechanism of diffraction contrast formation in imaging mode. a0, b0, c0, and d0 represent the rays in the incident electron beam, a1, a2, b1, c1, and d1 the rays in diffracted beams, and a3, b2, c2, and d2 the rays in the directly transmitted beam. The direction deviation of the transmitted rays from that of the incident electron beam is due to a magnification caused by the lenses between the specimen and the imaging plane. When only the a2 and d1 rays are selected with an objective aperture there are three different contrasts on the image plane:
i) (B) and (C) show dark contrast, formed in the regions of the specimen which diffract all electrons out of the image plane and/or out of the objective aperture;
ii) (A) shows gray contrast, formed in the region which diffracts some but not all electrons;
iii) (D) shows white contrast, formed in the regions through which electrons pass without diffraction.
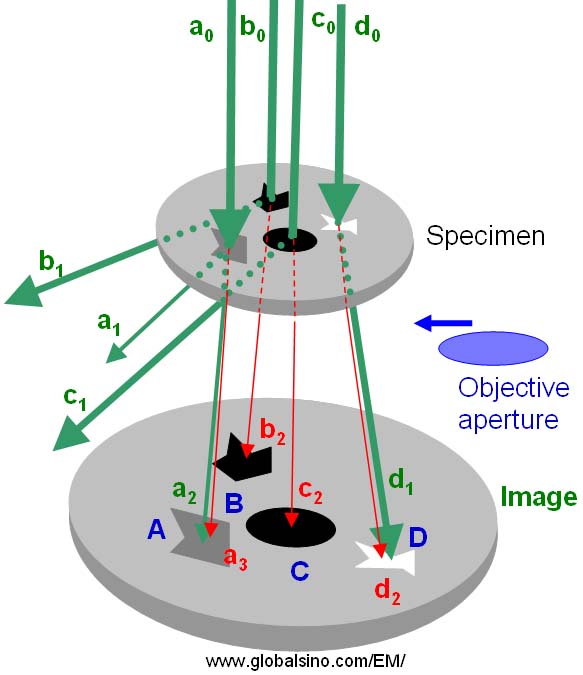
Figure 3355b. Schematic illustration of diffraction contrast formation in TEM imaging mode.
Figure 3355c illustrates the comparison of the main contrasts in both CTEM and STEM modes.
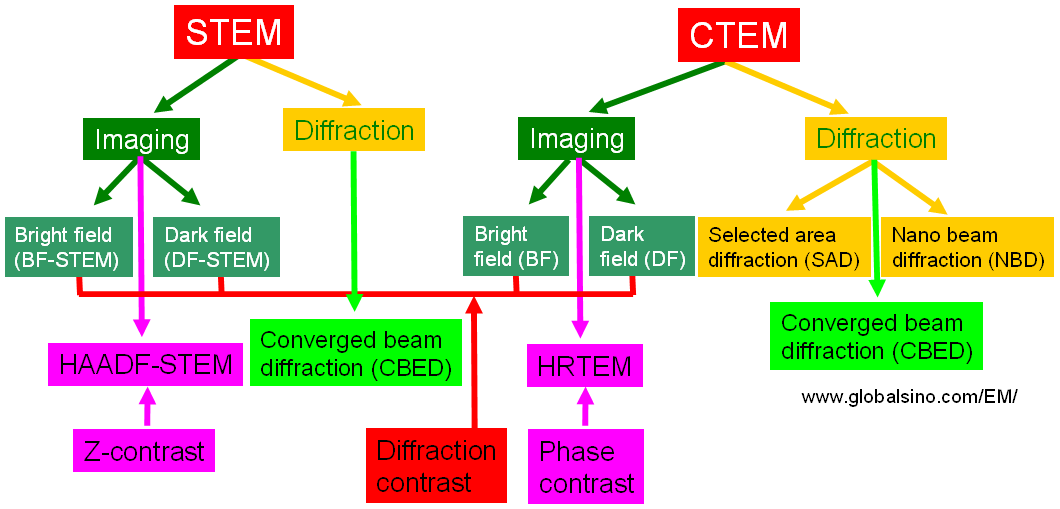
Figure 3355c. Comparison of the main contrasts in both CTEM and STEM modes.
Diffraction contrast in TEM can be typically applied to:
i) Measure grain sizes,
ii) Evaluate dislocation density,
iii) Quantify strain fields of dislocations,
iv) Determine phases (crystalline, polycrystalline, and amorphous).
Crystalline specimens have to be tilted in a goniometer in TEM in order to:
i) Observe lattice fringes and crystal structures.
ii) Determine the crystal orientation.
iii) Observe diffraction contrast of lattice defects with certain Bragg reflections or known orientation.
iv) Determine the Burgers vector of lattice defects.
|