EELS Measurement of Palladium (Pd) - Practical Electron Microscopy and Database - - An Online Book - |
|||||||||||||||||||||||||
| Microanalysis | EM Book http://www.globalsino.com/EM/ | |||||||||||||||||||||||||
Table 3425 lists the comparison of EELS and EDS measurements on thin TEM samples with Pd elements. The comparisons are based on the same data acquisition condition, consequently the same electron dose used.
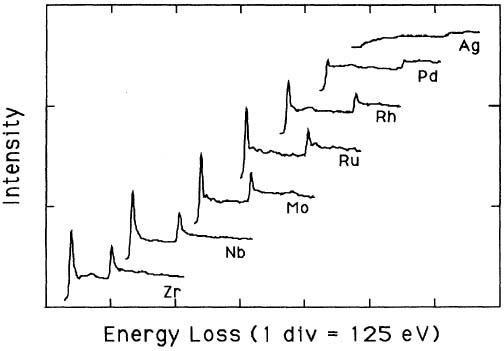
Pearson et al. [1] experimentally and theoretically (based on one-electron Hartree-Slater calculations) found that the intensities of L2,3 white lines for most of the 3d and 4d transition metals decreased nearly linearly with increasing atomic number, reflecting the filling of the d states. Figure 3425a shows the deconvoluted and background-subtracted L2,3 energy-loss spectra for the 4d transition metals. The edge energies are not shown in order to present all the spectra on the same figure, while the intensities of the white lines are scaled simultaneously for all elements.
If transitions between all of the filled and unfilled states of Pd were allowed, the interband transitions may be expected to produce numerous energy losses distributed over a wide range of energies in the EELS profile. Figure 3425b shows the plasmon and low-energy core-loss peaks of yttrium (Y) and palladium (Pd). For the case of Y, the plasmon and core-loss peak can well be separated by spectra fitting with a polynomial function, while for the case of Pd with completed d shells its plasmon peak (~8 eV) is accompanied by a number of other features and their separation can hardly be achieved unambiguously. Those features of Pd probably correspond to different excitations of the composite outer shell consisting of different 4d+5s+5p electronic configurations [2]. Therefore, this interpretation suggests that the number of valence electrons per atom involved in plasmon scattering is larger than number of electrons taking part in chemical reactions.
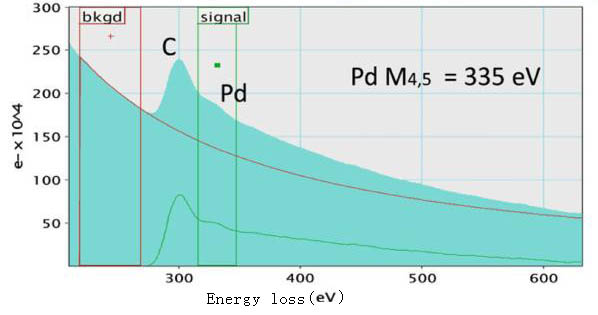
Figure 3425c shows an EEL spectrum, presenting Pd-M4,5 edge at 335 eV, taken from a Pd nanoparticle on holey carbon (C) film. Both the C and Pd signals are clear. In order to extract the Pd signal, the energy window for background subtraction is selected before the C K edge but not immediately before the Pd-M4 edge onset since there is uncertainty which is induced by the carbon peak.
[1] D. H. Pearson, C. C. Ahn, and B.Fultz, White lines and d-electron occupancies for the 3d and 4d transition metals, Physical Review B, 47(14), (1993) 8471-8478.
|
|
||||||||||||||||||||||||