White Lines in EELS - Practical Electron Microscopy and Database - - An Online Book - |
||||||
| Microanalysis | EM Book https://www.globalsino.com/EM/ | ||||||
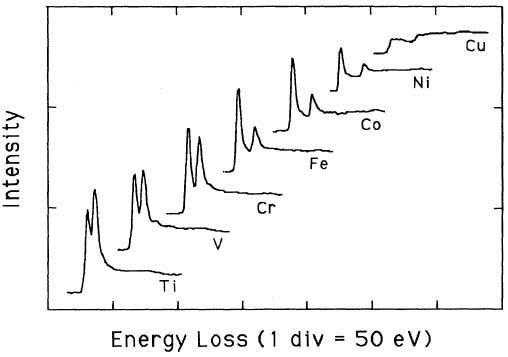
White lines are the outstanding features observed in the electron-energy-loss spectra (EELS) and x-ray-absorption spectra (XAS) of transition metals, presented at the onsets of the L2 and L3 absorption edges. These white lines arising from transitions from the 2p core level are induced by the excitations of 2p1/2 and 2p3/2 core electrons to unoccupied d-like states near the Fermi level (dipole transitions). The white-line intensities represent the unoccupied 3d density of states (DOS). These peaks are normally quite intense for the transition metals and their alloys of each transition series. The peaks have been called white lines because they were originally observed in overexposed regions on the photographic film used to record x-ray-absorption spectra [1]. Based on an atomic, one-electron model Mattheiss and Dietz [2] had shown that the total area (Atotal) of A2 and A3 under the L2 and L3 white lines is given by, where, R2p represent R2p3/2 and R2p1/2 (assuming R2p3/2 and R2p1/2 are approximately equal). Here, R2p3/2 and R2p1/2 are the radial matrix elements for the excitations of the 2p3/2 and 2p1/2 core electrons. htotal is the total number of d holes (or alternatively, d occupancy). Pearson et al. [1] experimentally and theoretically (based on one-electron Hartree-Slater calculations) found that the intensities of L2,3 white lines for most of the 3d and 4d transition metals decreased nearly linearly with increasing atomic number, reflecting the filling of the d states. Figure 3436 shows the deconvoluted and background-subtracted L2,3 energy-loss spectra for the 3d transition metals. The edge energies are not shown in order to present all the spectra in the same figure, while the intensities of the white lines are scaled simultaneously for all elements. Metallic Cu does not have these two L3 and L2 lines since its d-band is fully occupied, while all the other transition elements from Ti (22) to Ni (28) have clearly.
[1] J. Veldkamp, Physica 2, 25 (1935). |
|
|||||