=================================================================================
Figure 3726a shows the schematic illustrations of the electric circuits of thermionic electron emission guns and thermal FEGs (field electron guns). The main difference between the two types of electron guns is green-boxed in both figures.
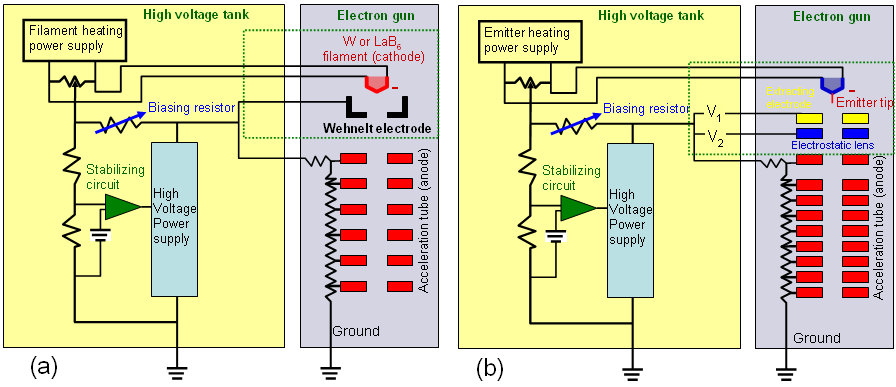
Figure 3726a. Schematic illustrations of the electric circuits of thermionic electron emission guns (a) and thermal FEGs (field electron guns) (b), respectively.
For the weak phase object approximation the diffractogram obtained using EFG-TEMs is the same as that using a CTEM based on W (tungsten) or LaB6 electron guns.
FEG-TEMs with field-emission electron sources [1 - 2] offering much better spatial and temporal coherence than those offered by CTEMs with LaB6 and W (tungsten) electron guns. Therefore, FEG-TEMs have allowed images to contain much higher spatial frequencies [3 - 4].
In images formed by elastic scattering (e.g. HRTEM images), contrast delocalization is referred to as the loss of image contrast due to lens aberrations or called blurring effect. In this case, the image information is blurred and displaced from their true locations in the TEM specimen. In other words, the contrast delocalization can also be expressed as the lateral displacement of spatial frequencies in the image. This displacement increases with spatial frequency significantly. It is rarely a problem on the microscopes with LaB6 guns due to their limited coherence in illumination. However, it is a significant imaging artifact in HRTEM images taken from microscopes with field emission guns (FEGs) due to their high coherence that causes a strong contribution of the high spatial frequencies.
Figure 3726b shows the calculated phase contrast transfer functions (pCTF) at Scherzer defoci in 200-keV TEMs with LaB6 and FEG sources and with different spherical aberrations (Cs).
Figure 3726b. Typical pCTFs for 200-keV TEMs: (a) At Scherzer defocus in LaB6 TEM with large positive Cs (1.23 mm), (b) At Scherzer defocus in FEG TEM with large positive Cs (1.23 mm), (c) At Scherzer defocus in FEG TEM with small positive Cs (0.083 mm), and (d) At Scherzer defocus = Lichte defocus in FEG TEM with small negative Cs. Adapted from [5]
[1] M.T. Otten, W.M.J. Coene, Ultramicroscopy 48 (1–2)
(1993) 77–91.
[2] T. Honda, T. Tomita, T. Kaneyama, Y. Ishida, Ultramicroscopy
54 (2–4) (1994) 132–144.
[3] W. Coene, G. Janssen, M. Op de Beeck, D. van Dyck,
Phys. Rev. Lett. 69 (1992) 3743–3747.
[4] M. Op de Beeck, D. van Dyck, W. Coene, Ultramicroscopy
64 (1–4) (1996) 167–183.
[5] Markus Lentzen, Progress in Aberration-Corrected High-Resolution Transmission Electron Microscopy Using Hardware Aberration Correction, Microsc. Microanal. 12, 191–205, 2006.
|