Deconvolution in EDS Analysis
- Practical Electron Microscopy and Database -
- An Online Book -
Electron microscopy
  Microanalysis | EM Book                                                                   https://www.globalsino.com/EM/  


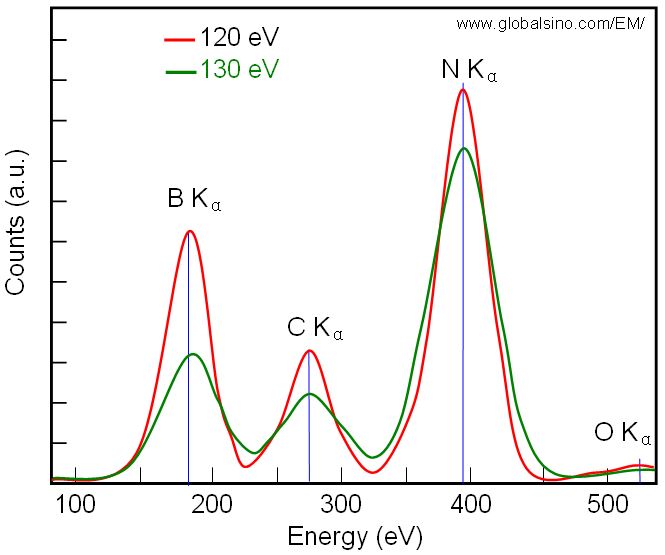
For EDS analysis, it is necessary to highlight that except for the random errors from counting statistics, some factors, however, will contribute systematic errors. Those factors are mainly:
         i) Accuracy of the chemical composition of the standard (if calibration or correction of kAB factors is applied).
         ii) Presence of spurious X-rays.
         iii) Inaccuracy of evaluation of the specimen thickness.
         iv) Inaccurate deconvolution of overlapping peaks.
         v) Inaccurate background-fitting.

Deconvolution can only be done by optimizing the whole line series. However, deconvolution is not necessary if there is no line overlaps in the spectrum.

The deconvolution in EDS analysis can be tricky mainly because:
         i) The shape of the background in the relevant energy range is difficult to model.
         ii) The peak shape is usually not purely Gaussian, making deconvolution difficult.

Figure 2359a shows two schematic spectra obtained from two EDS detectors with energy resolutions at Mn Kα 120 eV and 130 eV, respectively. It is clear that higher spectrum peak can be obtained with better resolution. Consequently, the higher peak improves the peak-to-background ratio and facilitates the spectrum deconvolution.

Schematic spectra obtained from two EDS detectors with energy resolutions at Mn Kα 120 eV and 130 eV, respectively

Figure 2359a. Schematic spectra obtained from two EDS detectors with energy resolutions at Mn Kα 120 eV and 130 eV, respectively.

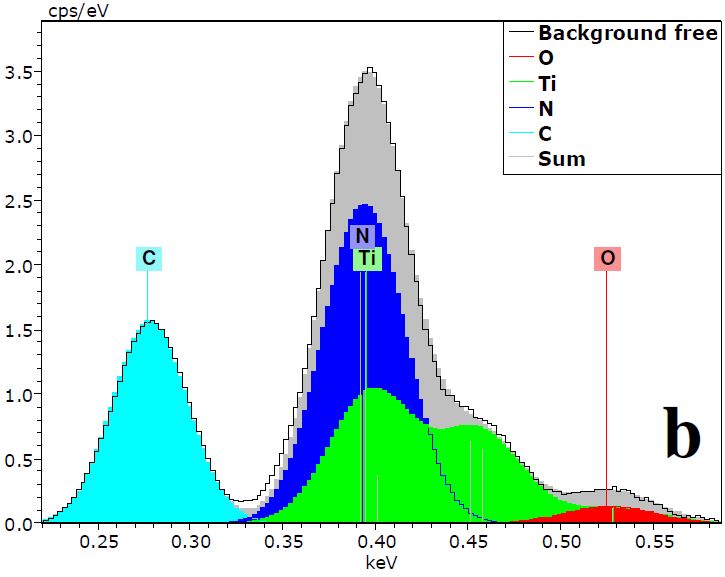
Figure 2359b shows the deconvolution of an EDX spectrum with peak overlaps, taken from a material that contains O, Ti, N, and C elements.

Deconvolution of an EDX spectrum with peak overlaps

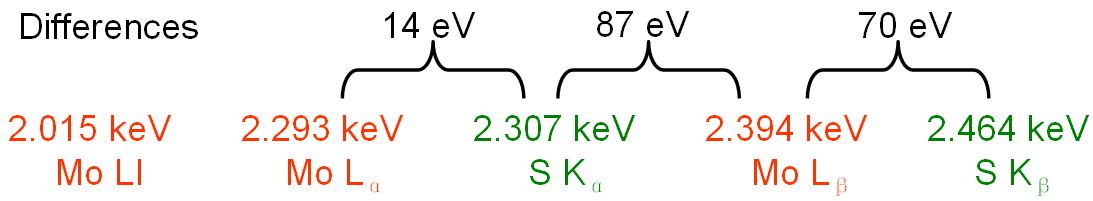
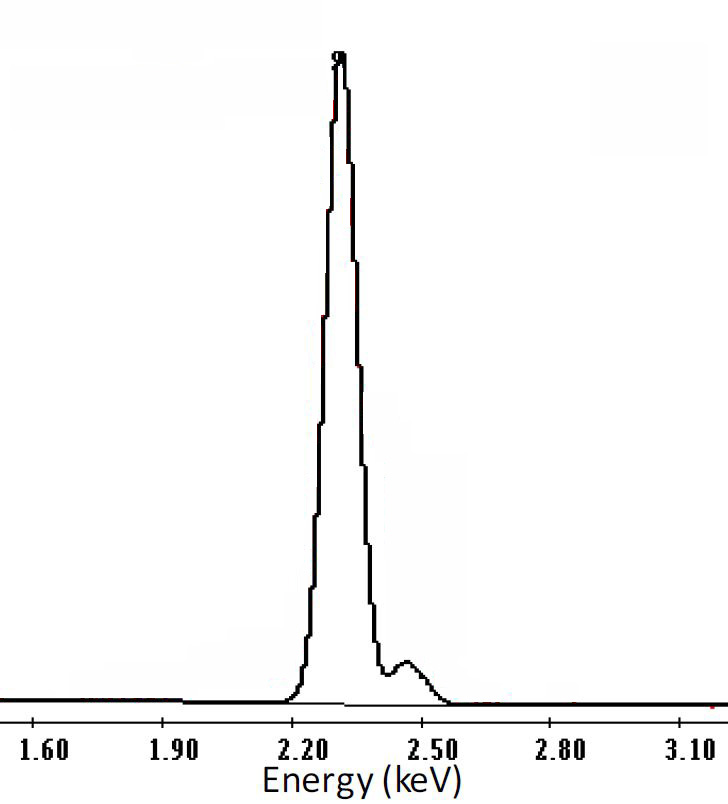
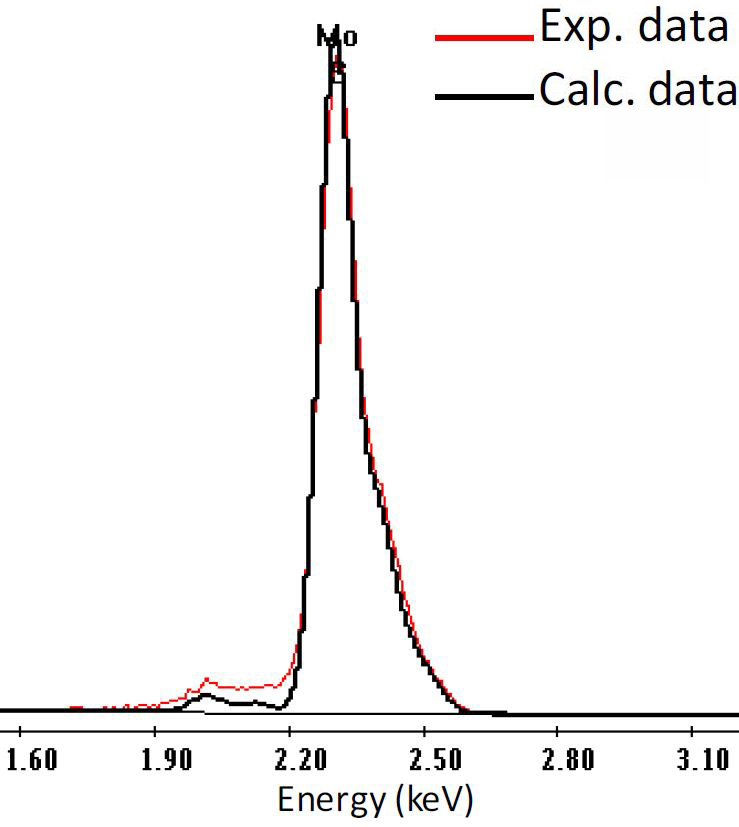
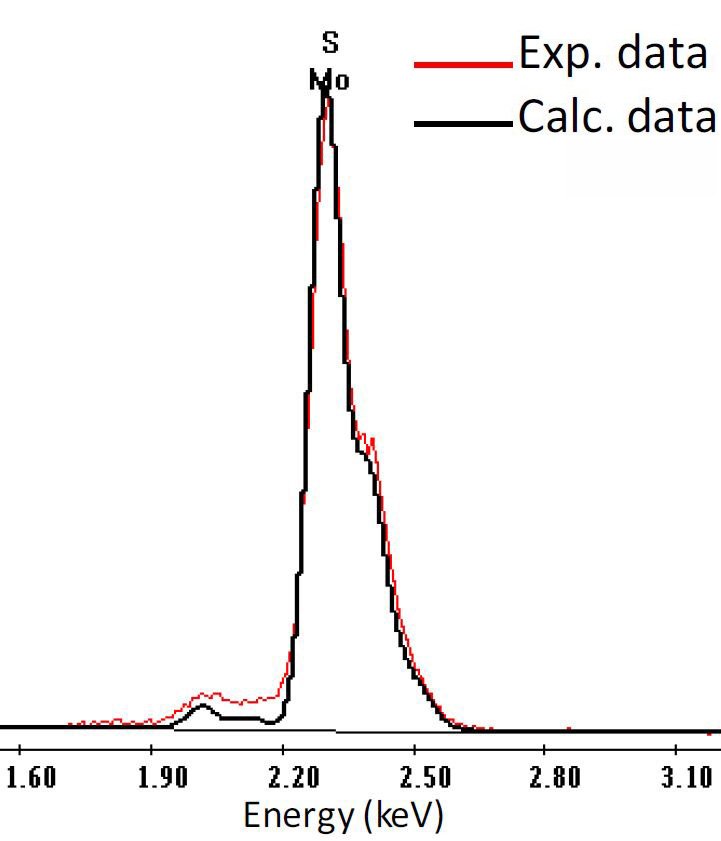
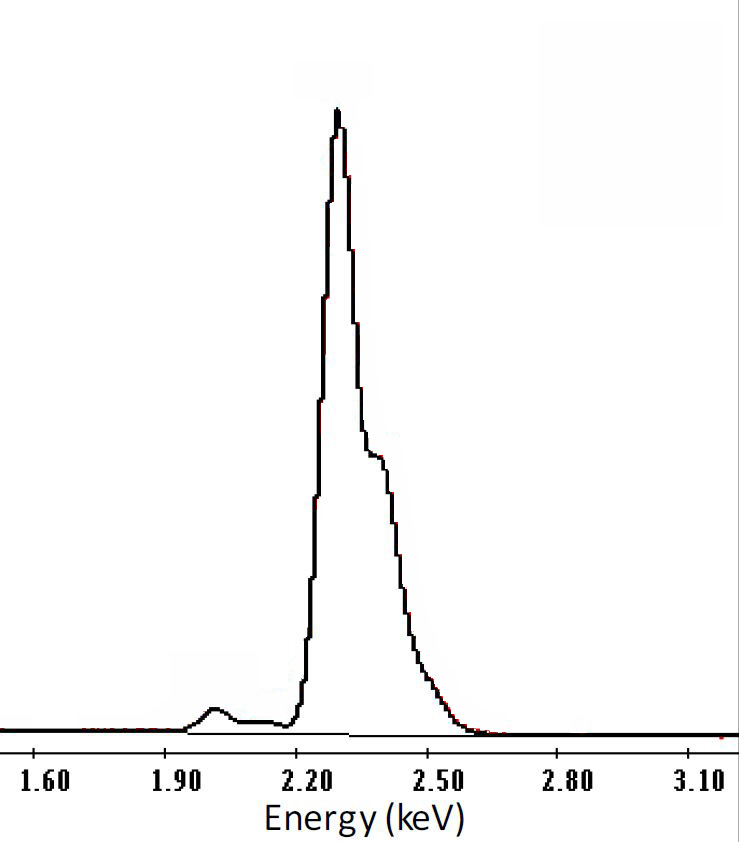
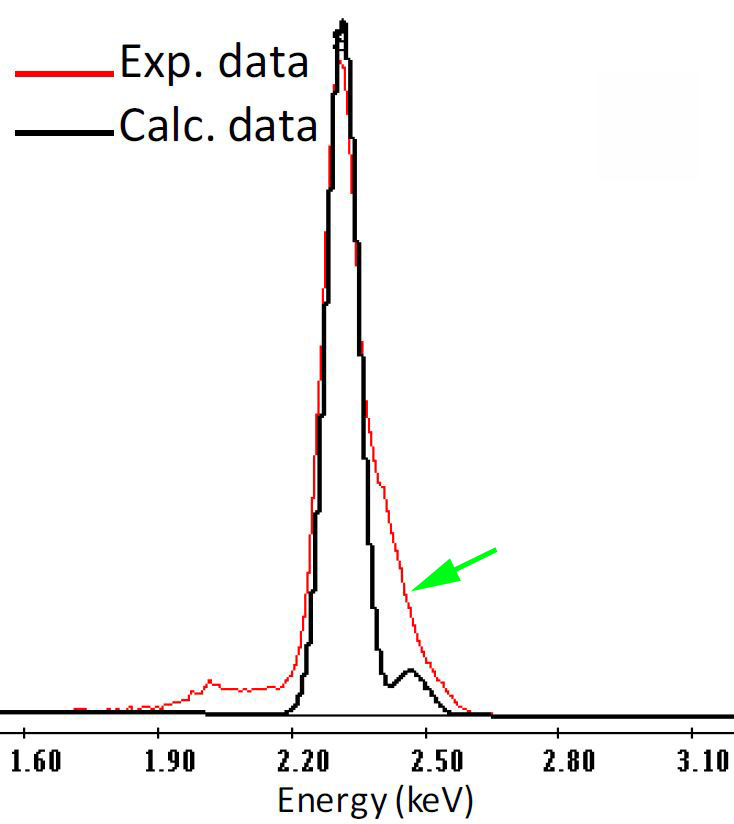
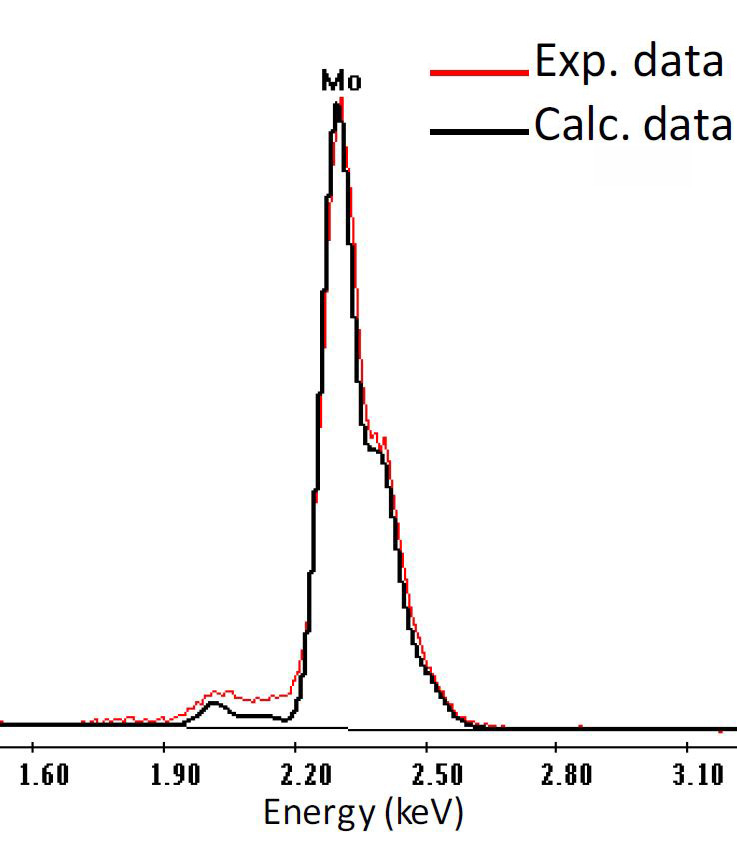
Figure 2359b. Deconvolution of an EDX spectrum with peak overlaps. [1]

Table 2359 shows the calculated (in black) and experimental (in red) peaks of samples with pure sulfur, pure molybdenum, 1 wt% S + 99 wt% Mo, and 15 wt% S + 85 wt% Mo. The main consideration about the match between calculated and experimental curves are the portion of 1.2 times of the full width at half maximum (FWHM) of the peaks. For the sample with 1 wt% S + 99 wt% Mo, the maximum of the calculated peak does not match the maximum of the experimental one since the calculated curve slightly shifts to the left of the experimental curve, while the two peaks of the calculated and experimental curves match each other better when 1 wt% S is considered. For the sample with 15 wt% S + 85 wt% Mo, the shapes of the calculated and experimental curves math each other when 15 wt% S is considered.
Table 2359 shows the calculated (in black) and experimental (in red) peaks of samples with pure sulfur, pure molybdenum, 1 wt% S + 99 wt% Mo, and 15 wt% S + 85 wt% Mo. The figures of EDS curves are adapted from [2].
 
S only
15 % S + 85 % Mo
1 % S + 99 % Mo
Mo only
X-ray lines
MoS2 EDS
Energy resolution of EDS detector
~130 eV (larger than the differences above so that the detector cannot resolve the differences)
Correct calculation of curves
S EDS
15 % S + 85 % Mo EDS
1 % S + 99 % Mo
Mo EDS
Both of black and red curves are EDS of 15 % S + 85 % Mo. The peaks of the calculated and experimental curves match each other when 15 wt% S is considered Both of black and red curves are EDS of 1 % S + 99 % Mo. The peaks of the calculated and experimental curves match each other when 1 wt% S is considered
Wrong calculation of curves  
Mo and S EDS
1 % S + 99 % Mo EDS
 
  Black curve is EDS of pure S, and red curve is EDS of 15 % S + 85 % Mo. The calculated and experimental curves do not match each other (see the green arrow) when no Mo is considered Black curve is EDS of pure Mo, and red curve is EDS of 1 % S + 99 % Mo. The peaks of the calculated and experimental curves do not match each other when no Mo is considered  


[1] J. Berlin, T. Salge, M. Falke, and D. Goran, Recent Advances in EDS and EBSD Technology: Revolutionizing the Chemical Analysis of Chondritic Meteorites at the Micro- and Nanometer Scale, 42nd Lunar and Planetary Science Conference, 2723, (2011).
[2] Carlos Angeles-Chavez, Jose Antonio Toledo-Antonio and Maria Antonia Cortes-Jacome, Chemical Quantification Mo-S W-Si Ti-V by Energy Dispersive X-Ray Spectroscopy, in X-Ray Spectroscopy, edited by Shatendra K Sharma, 2012.


;