=================================================================================
Because the CCD exposure time in EELS measurements cannot be too short, Kimoto et al. [1] employed a so-called streak imaging technique to obtain high-speed spectrum acquisition. The streak imaging technique that was originally applied to visualize energy instability [2] is similar to a chart recorder, as shown in Figure 2599a, where the high-speed spectrum acquisition is achieved by exposing a full-frame CCD during the readout period. Another EEL spectrum is continuously projected on the CCD camera during the parallel shift (i.e. exposure time) of the well electrons. This allows acquiring a series of time-resolved spectra as a two-dimensional image. The time resolution depends on the duration of a well-electron transfer to the adjacent line. Additional benefit is that this spectrum acquisition technique is effective in avoiding artifacts due to the slow beam blanking of an exposure shutter.
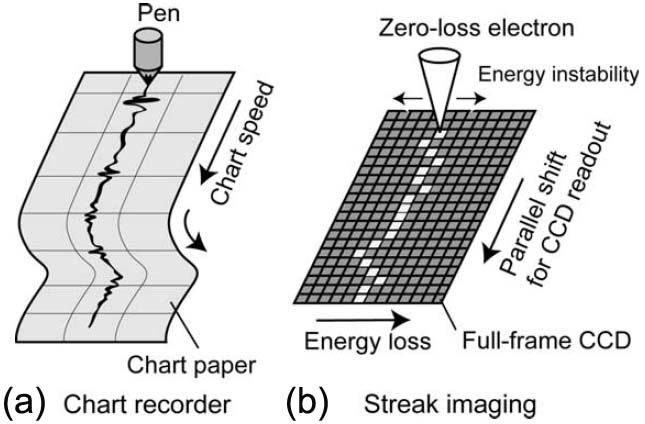
Figure 2599a. Schematic illustration showing the similarity between a chart recorder (a) and a streak imaging technique (b). [3]
Figure 2599b (a) shows a streak image, consisting of 1024 EEL spectra, with the zero-loss peak (ZLP) taken in a microscope with a cold field emission gun (CFEG) and an exposure time of 0.353 ms (total exposure time is 0.36 s). Figure 2599b (b) and (c) shows the FWHMs (Full width at half maximum) of the ZLP and the energy instabilities measured using cross-correlation, respectively. Figure 2599b (d) shows the Fourier transform of the instability, revealing several peaks with the major peaks at 50 and 150 Hz, originating from the mains frequency field. Kimoto et al. [3] proposed that the peak at ~10 Hz might be an eigenfrequency of the mechanical vibration of the Gatan GIF2002 EELS system.
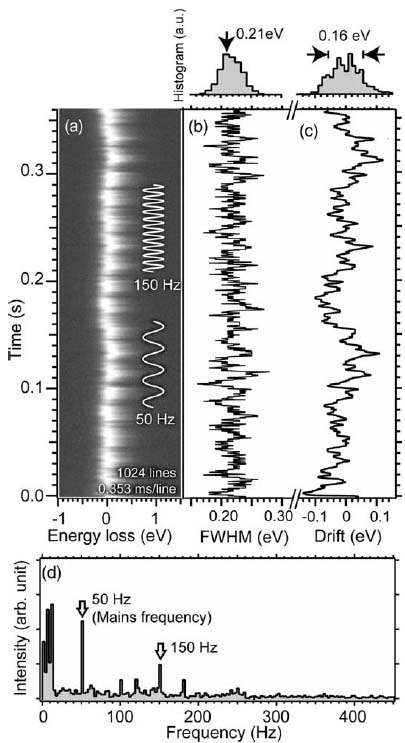
Figure 2599b. (a) Streak image of ZLP, (b) FWHMs of ZLPs, (c) The relative drifts of ZLPs, and (d) Fourier transform of relative drifts. [3]
[1] Kimoto, K., Kothleitner, G., Grogger, W., Matsui, Y., Hofer, F., 2005.
Advantages of a monochromator for bandgap measurements using
electron energy-loss spectroscopy. Micron 36, 185–189.
[2] Brink, H.A., Barfels, M.M.G., Burgner, R.P., Edwards, B.N., 2003. A
sub-50 meV spectrometer and energy filter for use in
combination with 200 kV monochromated (S)TEMs. Ultramicroscopy
96, 367–384.
[3] Koji Kimoto, Kazuo Ishizuka, Toru Asaka, Takuro Nagai, Yoshio Matsui, 0.23 eV energy resolution obtained using a cold field-emission gun and a streak imaging technique, Micron 36 (2005) 465–469.
|