Analysis of Valence States by White-Lines in EELS - Practical Electron Microscopy and Database - - An Online Book - |
|||||
| Microanalysis | EM Book http://www.globalsino.com/EM/ | |||||
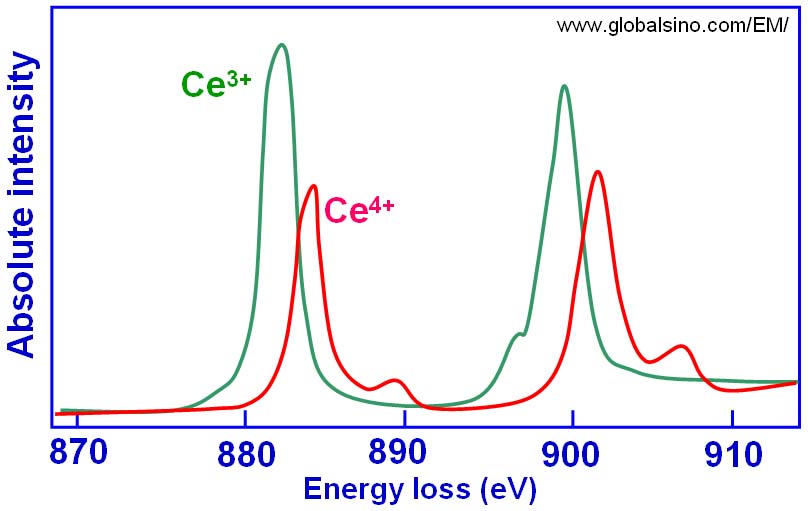
Valence state of transition metals, e.g. in the positive electrode and charge transfer during lithiation and delithiation processes in Li-ion battery materials, can be analyzed by measuring the relative intensity of the transition metal L3 and L2 lines. In order to determine the oxidation states of 3d and 4d transition metals in unknown oxides or alloys, EEL spectra at the L3/L2 edge of white-lines can be recorded from known (standard) specimens first. In the analysis of valence states based on white-lines in EELS, the accuracy of the determination of the ratios of the two valence states (e.g. Ce4+/Ce3+ for cerium) depends on the ability to separate the contributions of the two oxidation states. Table 2643 lists the M5 to M4 area and branching ratios of Ce-bearing materials and Figure 2643a shows the simulated peaks originated from Ce4+ and Ce3+ valence states. Table 2643. The M5 to M4 area and branching ratios of Ce-bearing materials. [1]
aM5/M4 branching ratio is defined as the intensity ratio I (M5)/[I (M4) + I (M5)].
Figure 2643a. The simulated peaks originated from Ce4+ and Ce3+ valence states.
The Ti L2,3 near-edge structures in EELS spectrum for Ti3+ and Ti4+ are different as shown in Figure 2643b. Here the blue curve shows the fine structure of Ti3+ state , while the red curve shows the fine structure of Ti4+ state. The doted curve is an experimental data from a mixture of SrTiO3 (with Ti4+) and LaTiO3 (with Ti3+) materials and thus can be decomposed into a linear combination of Ti3+ and Ti4+.
Figure 2643b. The Ti L2,3 near-edge structures in EELS spectrum for Ti3+ and Ti4+. Adapted from [2].
[1] L.A.J. Garvie and P.R. Buseck, Determination of Ce4+/Ce3+ in electron-beam-damaged CeO2 by electron energy-loss spectroscopy, Journal of Physics and Chemistry of Solids 60 (1999) 1943–1947.
|
|
||||