=================================================================================
Figure 3423a (a) shows a TEM image of a RuO2/TiO2 core/shell structure (a RuO2 nanorod shelled with a TiO2 layer) in diameter of 160 nm. Figure 3423a (b) shows the EELS spectra taken from the selected positions in Figure 3423a (a) that are marked by A and B for the RuO2/TiO2 core/shell structure and a pure RuO2 nanorod without TiO2 coating, respectively. For the EEL spectrum from the TiO2 shell (position B), the ELNESs of Ti L2,3- and O K-edges are clearly found. In the spectrum obtained from position A, the Ru M-edge is present, while the Ti L2,3- and O K-edges are not so clear because the wire-shaped specimen is too thick (about 220 nm in wire-diameter) for EELS measurements.
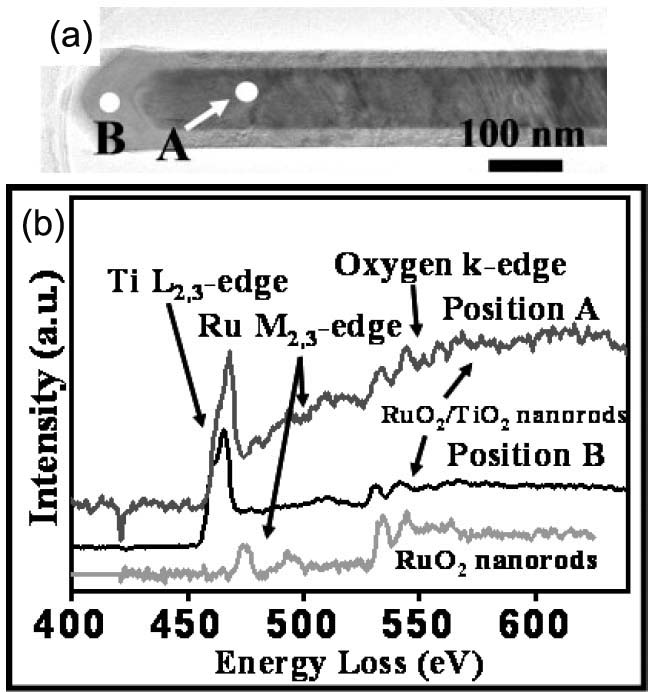
Figure 3423a. (a). The TEM image of a RuO2/TiO2 core/shell structure in diameter of 160 nm. (b) EELS spectrum for the Ti L-edge and O K-edge ELNEFS of the RuO2/TiO2 core/shell structure taken from two points, labeled A and B for the RuO2/TiO2 wire and the TiO2 shell, respectively. The bottom EELS spectrum was obtained from a pure RuO2 nanorod as reference.
Adapted from [2]
The EEL spectra in Figure 3423b presents Ru M4,5 edges in a series of Co–Rux–B-O catalysts. By comparison with the references (commercial RuO2 powder and pure Ru foil),
ruthenium in Co–Rux–B-O catalysts seems to be highly reduced all around the series with 0.13≤ xRu ≤ 1.
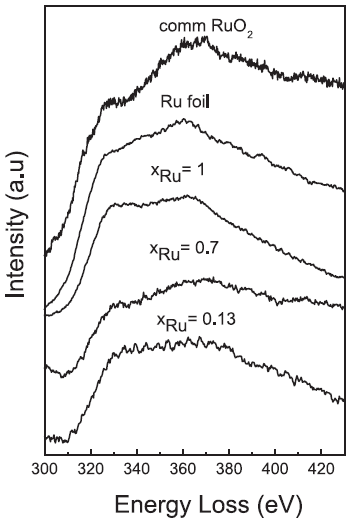
Figure 3423b. Ru M4,5 edges in the EELS spectra of Co–Ru–B-O catalysts.
[3]
Pearson et al. [1] experimentally and theoretically (based on one-electron Hartree-Slater calculations) found that the intensities of L2,3 white lines for most of the 3d and 4d transition metals decreased nearly linearly with increasing atomic number, reflecting the filling of the d states. Figure 3423c shows the deconvoluted and background-subtracted L2,3 energy-loss spectra for the 4d transition metals. The edge energies are not shown in order to present all the spectra on the same figure, while the intensities of the white lines are scaled simultaneously for all elements.
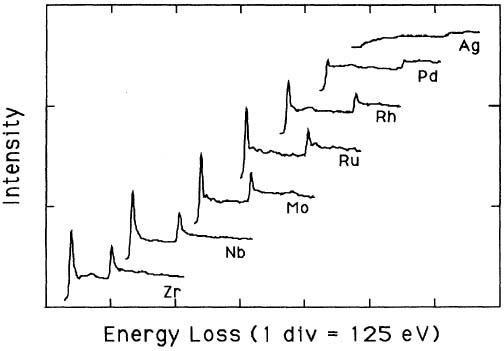
Figure 3423c. The deconvoluted and background-subtracted L2,3 energy-loss spectra for the 4d transition metals. [1]
[1] D. H. Pearson, C. C. Ahn, and B.Fultz, White lines and d-electron occupancies for the 3d and 4d transition metals, Physical Review B, 47(14), (1993) 8471-8478.
[2] Yu-Lun Chueh, Chin-Hua Hsieh, Mu-Tung Chang, Li-Jen Chou, Chang S. Lao, Jin H. Song, Jon-Yiew Gan, and Zhong L. Wang, RuO2 Nanowires and RuO2/TiO2 Core/Shell Nanowires: From Synthesis to Mechanical, Optical, Electrical, and Photoconductive Properties, Advanced Materials, 2007, 19 (1), 143–149.
[3] G.M. Arzac, T.C. Rojas, A. Fernández, New insights into the synergistic effect in bimetallic-boron catalysts for hydrogen generation: The Co–Ru–B system as a case study, Applied Catalysis B: Environmental 128 (2012) 39– 47.
|