Table 1437. Comparison between (HR)TEM and (HR)-HAADF-STEM imaging.
| |
(HR)TEM |
(HR)-HAADF-STEM |
| |
=============================== |
=============================== |
Magnification |
High magnification |
High magnification |
| |
|
Scattered electrons |
Highly-coherent elastically-scattered electrons |
Incoherent elastically-scattered electrons: each atom is an independent scatterer since there is no constructive or destructive interference between them |
| |
|
Imageing principle |
Interference of coherently scattered electron waves |
Incoherently elastic & quasi-elastical scattering of electrons |
| |
|
Imaging mode |
TEM: parallel recording with a parallel beam |
STEM: serial recording with a narrow probe at high angle (75 - 150 mrad) |
| |
|
Point resolution |
~2 Å (without) and < 0.5 Å (with aberration-correction) |
~2 Å (without) and < 0.5 Å (with aberration-correction) |
| |
|
Spatial resolution |
Assuming their lens properties are equivalent, the spatial resolution of HR-HAAD-STEM due to the incoherency is better and less disturbed by the microscope
defects than that of HR-TEM due to the coherency (see page1436). The resolution in HAADF imaging is less affected by phase errors induced by
objective lens than that in TEM imaging. |
| |
|
Recording time |
0.5 – 5 s |
5 – 30 s (More sample-stability- and drift-problems) |
| |
|
|
LaB6, tungsten, field-emission |
Field-emission |
| |
|
Obtainable information |
Atomic positions (or plus elemental distribution) |
Atomic positions and elemental distribution |
| |
|
Contrast |
Phase contrast: sum of the wavefunction amplitudes. The atom columns always appear dark at Scherzer defocus (see page4234). |
Z-contrast: sum of the intensities from individual atoms and thus atom columns are always bright |
| |
|
Contrast reverse |
Can be reversed by defocusing or by specimen thickness |
Cannot be reversed |
| |
|
Advantages |
Observation of (nano-)crystals in amorphous matrix |
Observation of chemical ordering in crystal matrix (e.g. quasicrystals) with Z-contrast function. |
| |
|
Data interpretation |
Easier technique (e.g. more easily distinguish between crystal and amorphous phases due to "less" serious requirements of specimen preparation) |
Atom types and positions are more easily and directly interpreted due to the incoherent property. |
| |
Specimen damage |
More radiation damage since the total electron dose is more |
Less radiation damage since the total electron dose is less |
| |
Image examples |
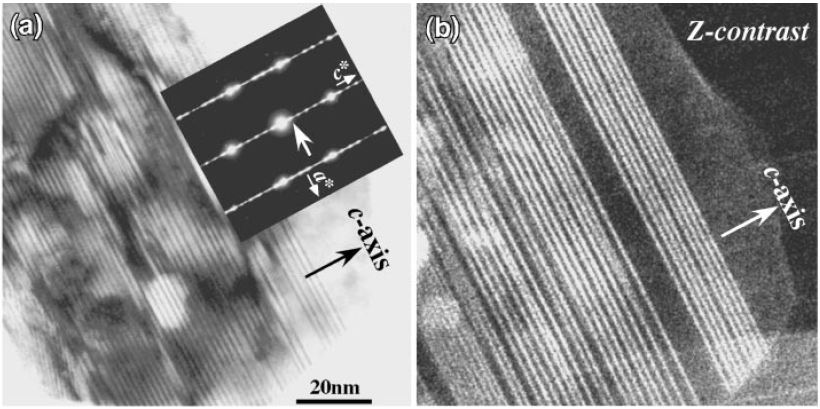
| Figure 1437a. (a) HRTEM and (b) HAADF-STEM images of nanocrystalline Mg97Zn1Y2 alloy. The inset in (a) is the corresponding electron diffraction pattern of the HRTEM image. (see page1604 for details) [1] |
|
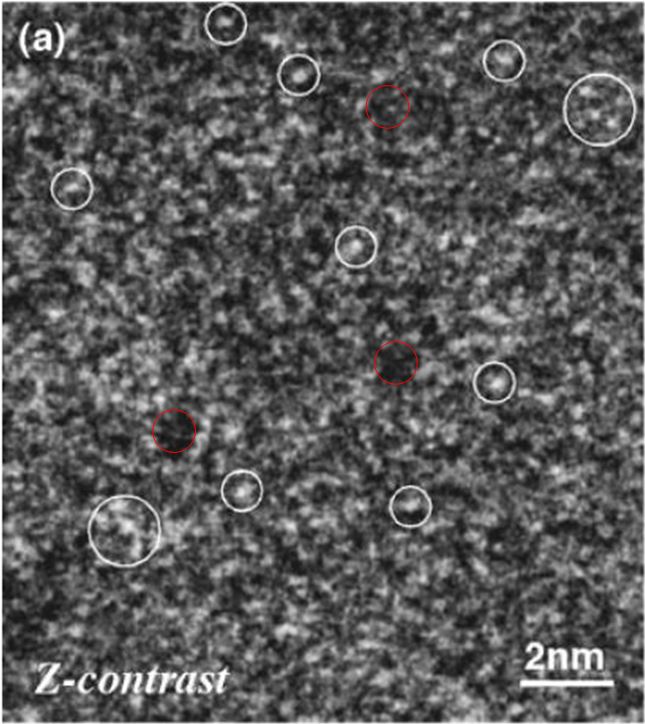
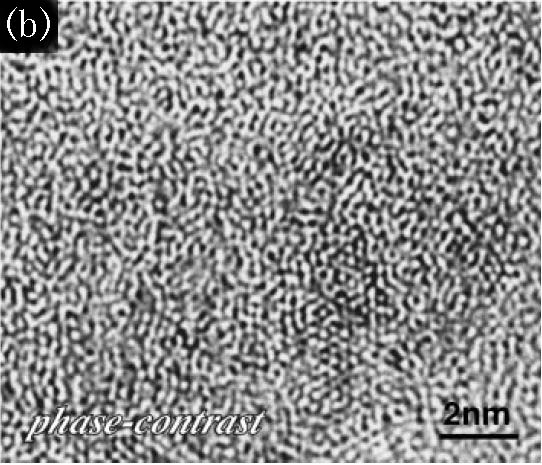
Figure 1437b. Microstructure of an Al87Ni7Cu3Ce3 amorphous alloy: (a) HAADF-STEM image and (b) HRTEM image of an Al87Ni7Cu3Ce3 amorphous alloy. In the HAADF-STEM (Z-contrast) image, some brightest spots in white circles represent heavy Ce atoms or its small clusters (Z=58), while some darkest areas in red circles represent fcc-Al (Z=13) nanostructures in the amorphous matrix. However, the HRTEM image does not present clearly the structures of fcc-Al nanocrystals. Adapted from [1] |
|
[1] Eiji Abe, Atomic-Scale Characterization of Nanostructured Metallic Materials by HAADF/Z-contrast STEM, Materials Transactions, 44(10), 2035-2041, (2003).