=================================================================================
Figure 1699a shows XRD patterns of Zr70-xNbxCu13.5Ni8.5Al8 (x=0, 2, 4, 6, 7, 8, 10) alloys. The broad peaks in the patterns of the samples with Nb content <8 at.% indicate the samples are in amorphous phase. The patterns of the samples with 8 and 10 at.% Nb present an intense double peak and several weak peaks that is indexed in icosahedral phase (I-phase) [2–4].
Figure 1699a. XRD patterns of the as-cast Zr–Nb–Cu–Ni–Al alloys. [1]
The method based on FFT and inverse FFT developed by Miller and Gibson [4] and extended by Li et al. [5] and Jiang and Atzmon [6] later was applied to analyze the SRO (short range ordering) clusters by Zhu et al. [1]. They employed a core–shell model to investigate the shear bands in as-cast Zr64Nb6Cu13.5Ni8.5Al8 specimen (Figure 1699b). In Figure 1699b (b), the bright-yellow part represents the zone with more free volume
(FV), while the dark-blue part represents the zone with less FV. The core is proposed as SRO clusters with a different coordination number (CN) [7] and the local FV is shell. It is defined that SRO clusters with CN of 12 or more than 12 have no FV, while ordering clusters with CN < 12 have certain FV [8].
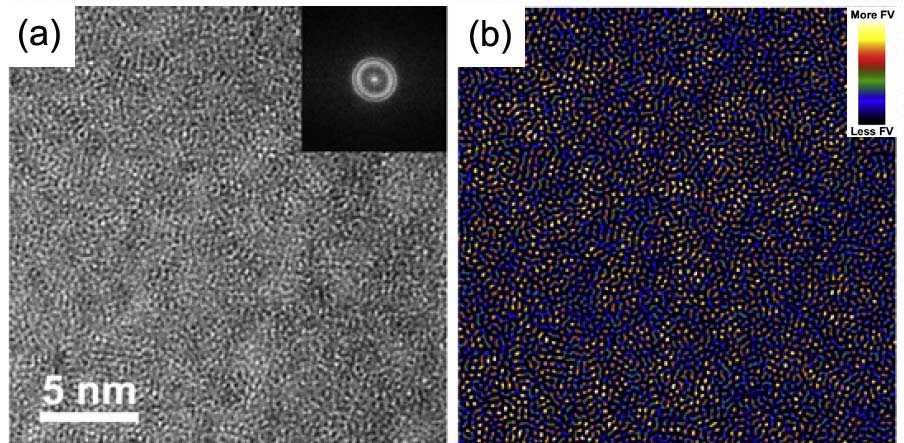
Figure 1699b. (a) HRTEM image of an as-cast sample for Zr64Nb6Cu13.5Ni8.5Al8 alloys (the inset presents fast Fourier transform (FFT) pattern), and (b) The corresponding Fourier-filtered, threshold filtered and inverted image. Adapted from [1]
Figure 1699c shows a TEM image taken from a Zr62Nb8Cu13.5Ni8.5Al8 specimen. The particles were identified as I-phase (Icosahedral Short-Range Ordering). The inset shows SAED patterns taken from three different particles, presenting two-, three- and fivefold symmetry, respectively.
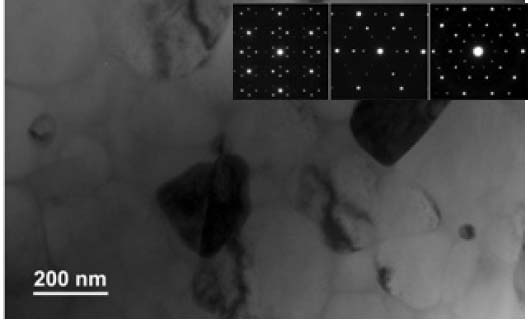
Figure 1699c. A TEM image taken from a Zr62Nb8Cu13.5Ni8.5Al8 specimen. Adapted from [1]
Figure 1699d shows a HRTEM and electron diffraction pattern of a thermally quenched Zr70Al8Cu13.5Ni8.5 MG (metallic glass). The absence of any nanocrystalline phase in the diffraction pattern confirms that this material consists of only a purely glassy structure in amorphous phase.
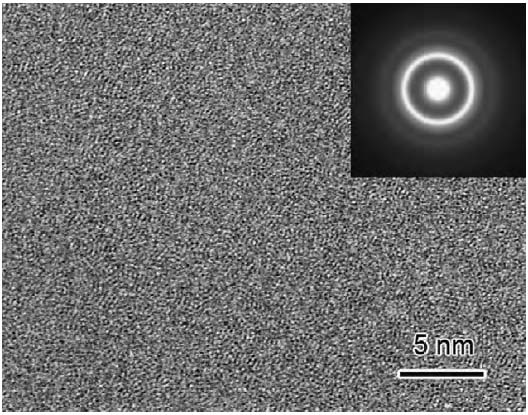
Figure 1699d. HRTEM and electron diffraction pattern of a thermally quenched Zr70Al8Cu13.5Ni8.5 metallic glass. [9]
Deng et al. [12] analyzed plastically deformed Zr55Al10Ni5Cu30 metallic glasses using SAED technique in TEM (see Figure 1699e). Although both the structures before and after plastic deformation process were in amorphous state, the diffraction pattern taken from the deformed specimen shows shrinkage (La/Lb = 0.87) and broadening of diffuse halo rings in the diffraction patterns. Those changes of the diffuse rings indicate the increase of interatomic spacing and/or free volume was induced by the deformation process.
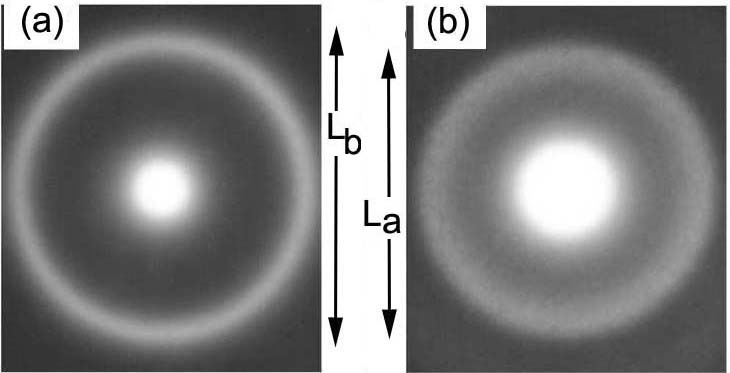
Figure 1699e. SAED patterns of a Zr55Al10Ni5Cu30 metallic glass before (a) and after (b) plastic deformation process.
Adapted from [12]
Figure 1699f shows the dependence of electrical resistivity on temperature for Zr57Al10Ni12.6Cu15.4Nb5 alloy at the heating rate of 15 K/min. The TCR (temperature coefficient of resistance) changes at about 670 K because of glass transition, and suddenly drops at the temperature of ~ 750 K because of crystallization. Tg-dep is the characteristic temperature, while Tx is the crystallization temperature.
Figure 1699f. The dependence of electrical resistivity on temperature of Zr57Al10Ni12.6Cu15.4Nb5 alloy at the heating rate of 15 K/min. [10]
Different techniques can be applied to prepare TEM specimens from amorphous materials. TEM specimens of Zr55Al10Ni5Cu30 amorphous alloy [11] were prepared by mechanically thinning 3-mm discs to 80 μm thick, and then by the standard twin-jet electrolytic thinning in an HCIO4–C2H5OH solution (volume ratio 1 : 10) at −25 °C, finally by the low-angle (5°) ion milling thinning for about 10 min. The goal of the ion milling step is to remove the residual chemicals attached on the specimen surface during the twin-jet thinning.
[1] Z.W. Zhu, L. Gu, G.Q. Xie, W. Zhang, A. Inoue, H.F. Zhang, Z.Q. Hu, Relation between icosahedral short-range ordering and plastic deformation in Zr–Nb–Cu–Ni–Al bulk metallic glasses, Acta Materialia 59 (2011) 2814–2822.
[2] Kuhn U, Eckert J, Mattern N, Schultz L. Appl Phys Lett 2000;77:3176.
[3] Fan C, Inoue A. Scripta Mater 2001;45:115.
[4] Peter D. Miller and J. Murray Gibson, Connecting small-angle diffraction with real-space images by quantitative transmission electron microscopy of amorphous thin-Þlms, Ultramicroscopy 74 (1998) 221-235.
[5] Li J, Wang ZL, Hufnagel TC. Phys Rev B 2002;65:144201.
[6] Jiang WH, Atzmon M. Acta Mater 2003;51:4095.
[7] Miracle DB, Sanders WS, Senkov ON. Philos Mag 2003;83:2409.
[8] Liu XJ, Chen GL, Hui XD, Liu CT, Lu ZP. Appl Phys Lett
2008;93:011911.
[9] Y.H. Li, W. Zhang, C. Dong, J.B. Qiang, K. Yubuta, A. Makino, A. Inoue, Unusual compressive plasticity of a centimeter-diameter Zr-based bulk metallic
glass with high Zr content, Journal of Alloys and Compounds 504S (2010) S2–S5.
[10] Jing Guo, Fangqiu Zu, Zhihao Chen, Shubin Zheng, Yuan Yuan, Exploration of a new method in determining the glass transition temperature of BMGs by electrical resistivity, Solid State Communications 135 (2005) 103–107.
[11] Deng Yu-Fu, Yang Fei, Yang Jian-Lin, and Zhang Wei, The increasing of localized free volume in bulk metallic glass under uniaxial compression, Chinese Physics, 16(7), (2007) 2051.
[12]
Deng Yu-Fu, Yang Fei, Yang Jian-Lin, and Zhang Wei, The increasing of localized free volume in bulk metallic glass under uniaxial compression, Chinese Physics, 16(7), (2007) 2051.
|