=================================================================================
At room temperature and ambient pressure, Ti (titanium) has a hexagonal close-packed structure (called α-phase) with the lattice constants listed in Table 1721a. Its unit cell has two atoms at (1/3, 2/3, 1/4) and (2/3, 1/3, 3/4) and the space group number is 194 (P63/mmc). At room temperature and high pressure, it changes to the ω-phase [1,2] with the lattice constants listed in Table 1721b. Its unit cell has three atoms at (0, 0, 0), (1/3, 2/3, 1/2), (2/3, 1/3, 1/2) and the space group is P6/mmm. The α → ω transition in Titanium is a typical example of martensitic transformation.
Table 1721a. Structural properties of poly-crystalline α-titanium.
Property |
|
Reference |
Lattice constants |
a (Å) |
b (Å) |
c/a |
| 2.951 |
4.684 |
1.5873* |
* Smaller than the ideal ratio of 1.633 for HCP |
|
|
Mean number of faces per grain |
14.2 |
[3] |
Grain boundary with the greatest relative area |
28°/[0001] misorientation and (31-40) and (7-2-50) grain boundary planes |
[3] |
Table 1721b. Lattice constants of ω-titanium at 25 °C.
| a (Å) |
b (Å) |
c/a |
4.598 |
2.822 |
~ 0.61 |
Table 1721c. Lattice constants of β-titanium.
| a (Å) |
b (Å) |
c (Å) |
3.32 |
3.32 |
3.32 |
Table 1721d. Properties of Ti metal.
Density (g-cm-3) |
4.51 |
Valence states |
3s, 3p, 3d, 4s |
Reference configuration |
3s23p63d24s0 |
Core radii for angular waves (a.u.) |
rs=1.25, rp=1.25, rd=1.65 |
Specific heat (cp, Jkg-1K-1)
|
520 |
Heat conductivity (kh,Wcm-1K-1)
|
0.17 |
Melting temperature (Tm, °C)
|
1668 |
Vaporization temperature (Tv, °C)
|
3280 |
|
403 |
Vaporization heat (Qv, J-g-1)
|
8790 |
Absorption (1-R) |
0.40 for 1 µm light |
Phase transformation |
at ~882 °C, from bcc (β-phase) at higher temperatures to hcp (α-phase) at lower temperatures |
Figure 1721a shows the solid solubility of some impurities (including Ti) in silicon.
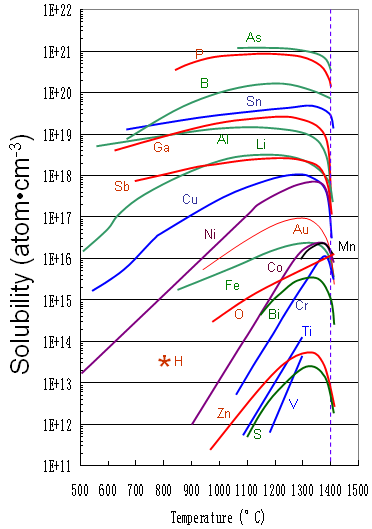
Figure 1721a. Solid solubility of impurities in silicon.
Figure 1721b shows the solubility for impurities (including Ti) in SiC.
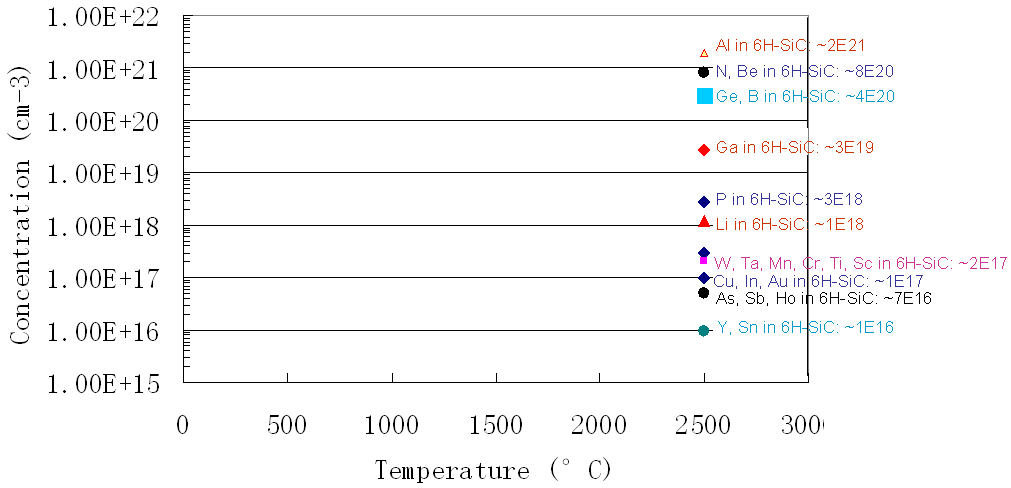
Figure 1721b. Solubility for impurities in SiC.
Table 1721e. Most closed packed d-spacing and planes in Ti and Ti-based crystals.
[1] Jamieson J.C., Science, 1963, 140, 72; doi:10.1126/science.140.3562.72.
[2] Sikka S.K., Vohra Y.K., Chidaraman R., Prog. Mater. Sci., 1982, 27, 245.
[3] Madeleine N. Kelly, Krzysztof Glowinski, Noel T. Nuhfer, Gregory S. Rohrer, The five parameter grain boundary character distribution of a-Ti determined from three-dimensional orientation data, Acta Materialia 111 (2016) 22-30.
|