=================================================================================
Figure 1961a shows a schematic of a focused, conical electron beam as it strikes the surface of the specimen, showing over-focus, in-focus and under-focus. For the over-focus case, the magnetic field is too strong, and the beam converges to a crossover above the surface of the specimen; however, for the under-focus case, the magnetic field is too weak so that the beam is not fully brought to crossover before it strikes the surface of the specimen. For both over-focus and under-focus cases, the beam diameter is broader than optimal, resulting in an out-of-focus image.
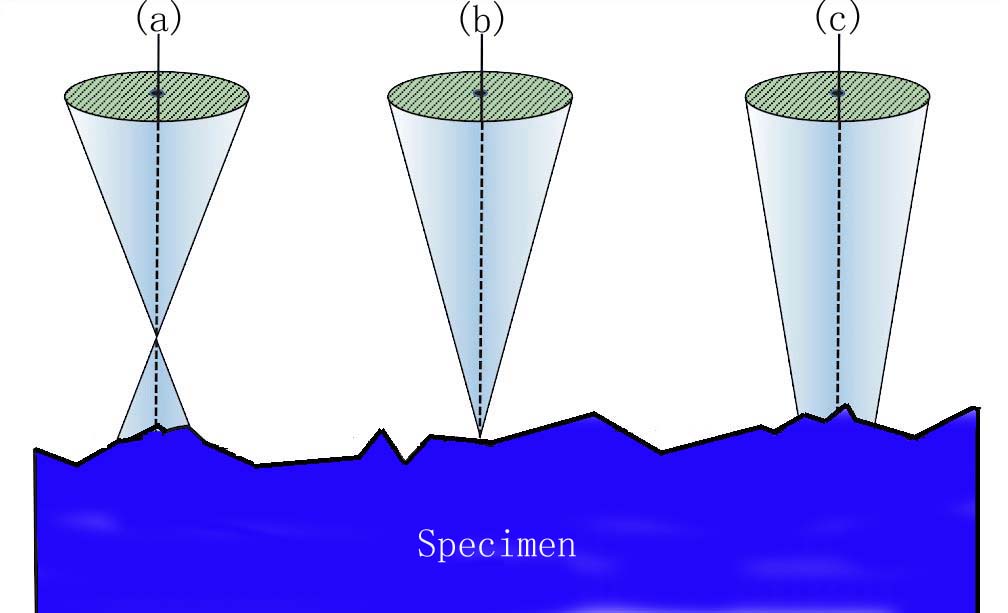
| Figure 1961a. Schematic of a focused, conical electron beam as it strikes the surface of the specimen, showing over-focus (a), in-focus (b), and under-focus (c). |
In TEM imaging, Fresnel diffraction occurs at the interface between two materials with different densities. At underfocus (the objective lens is focused below the specimen) a bright halo presents outside the area of greater density, while at overfocus (the objective lens is focused above the specimen) a dark fringe appears there. Unlike the experience with light microscopy, underfocus TEM images often appear somewhat sharper than in-focus electron images.
The intensity distribution of Fresnel fringes in TEM images varies with the defocus. There is a significant difference between slightly overfocused and underfocused images. Especially, the underfocused image shows an extremely high contrast up to Imax/Imin ~ 3. Here, is the maximum and the minimum intensities.
Figure 1961b shows typical Ronchigrams taken at the edge of an amorphous carbon film in STEM mode. At defoci (defined by z-height), there is a distance between the electron cross-over and the point on the specimen along the optic axis. At large underfocus, electron rays at all angles cross the optic axis after the specimen and it shows a shadow image of the specimen edge. At small underfocus, low-angle rays cross the optic axis after the specimen, while high-angle rays cross before the specimen due to spherical aberration. Therefore, the shadow image changes in magnification as a function of the angle. The low-angle asymmetry indicates the presence of astigmatism. At Gaussian focus, the lowest-angle rays cross the axis at the specimen, while higher-angle rays cross before the specimen due to the spherical aberration. The coma free axis is defined at this focus and all alignment and positioning of detectors and apertures can be performed with respect to the low-angle “disk”. Note that a single aberration violating the π/4 criterion may also cancel out the other one with the same symmetry if the have different sign, such as a small positive third-order spherical aberration and a small underfocus, or a small positive twofold astigmatism and a small negative third-order star aberration with the same azimuth. In particular, defocus and spherical aberration can effectively cancel each other at those lowest angles. Axial astigmatism can be accurately corrected by using the stigmator coils, resulting in circularly symmetric Ronchigram features. At overfocus, rays at all angles cross the axis before the specimen.
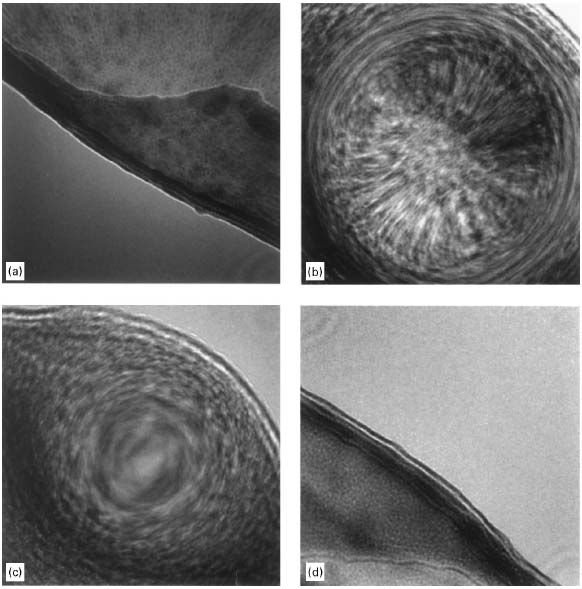
| Figure 1961b. Ronchigrams of a thin amorphous carbon (C) film at: (a) Large underfocus, (b) Small underfocus, (c) Gaussian focus, and (d) Overfocus.
[1] |
The Ronchigrams of a thin <110> silicon (Si) film in Figure 1961c shows the diffraction effects and fringes arising from the specimen periodicities. The visibility of the characteristic fringes depends on the precision of specimen tilt and the degree of probe coherence in a specific crystalline orientation. Figure 1961c (a) shows the Ronchigram at small underfocus. The lattice fringes are visible near the Ronchigram center and become extremely distorted at high angles because of the spherical aberration. Figure 1961c (b) shows the Ronchigram near Scherzer focus. The central fringes are large and wide. Figure 1961c (c) shows the Ronchigram at slight overfocus. The fringe spacing decreases with increasing angle from the Ronchigram center.
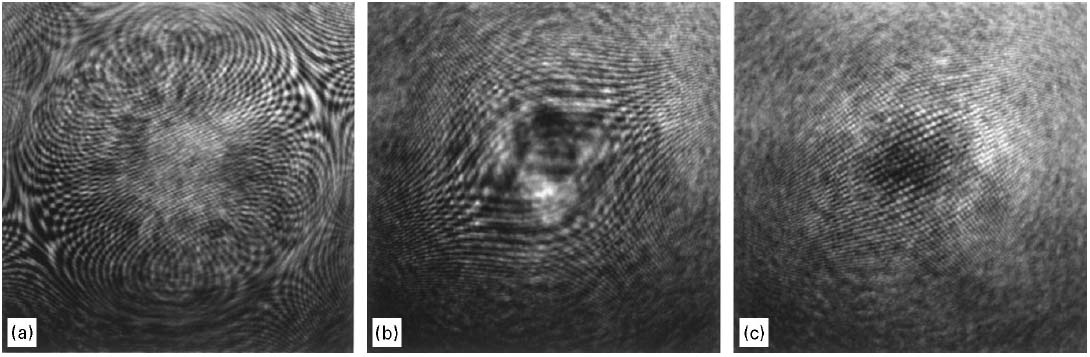
| Figure 1961c. The Ronchigrams of a thin <110> Si film: (a) At small underfocus, (b) Near Scherzer focus, and (c) At slight overfocus.
[1] |
Figure 1961d shows the TEM images of 1-nm He (helium) bubbles in palladium tritides when the specimen is oriented far from any Bragg conditions of the matrix of the palladium tritides [2]. For negative defocus (underfocus), the bubbles appear as white dots surrounded by a dark fringe, while for positive defocus (overfocus), the dots are black with white fringe.
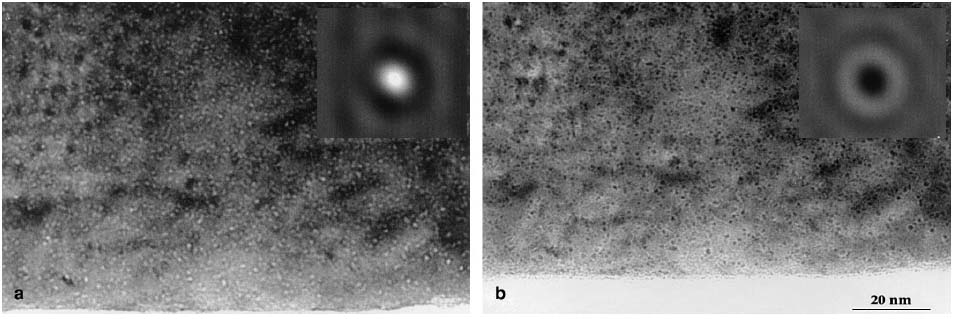
| Figure 1961d. The TEM images of 1-nm He (helium) bubbles in palladium tritides: (a) Underfocus and (b) Overfocus. The insets present theoretically simulated TEM contrasts of centered He bubbles in 6.5 nm thick TEM specimen. Adapted from [2] |
[1] E.M. James, N.D. Browning, Practical aspects of atomic resolution imaging and analysis in STEM, Ultramicroscopy 78 (1999) 125-139.
[2] S. Thiébaut, B. Décamps, J. M. Pénisson, B. Limacher, A. Percheron Guégan, TEM study of the aging of palladium-based alloys during tritium storage, Journal of Nuclear Materials 277 (2000) 217-225.
|