=================================================================================
The Ronchigram shadow images in STEM mode can be different if the specimen positions (or called defoci) are different or the lens aberrations are different. Figures 2748a (a), (b), and (c) show the cases when there is no lens aberrations while Figure 2748a (d) shows the case in which the specimen is near the cross-over with spherical aberrations. At focus, the probed area is the smallest and the image blows-up to "infinity" magnification. The image reverses from underfocus to overfocus.
Figure 2748a. Schematic illustration of the formation of Ronchigram shadow images for different defocus conditions. (a - c) present the cases in the absence of spherical aberration: (a) The probe is focused before the specimen, (b) The probe is focused after the specimen, and (c) The probe forms a cross-over where the specimen is. (d) The specimen is near the cross-over with spherical aberration where the off-axis rays come to a focus before the specimen and the near-axis rays come to a focus after the specimen. The region of near-infinite magnification can only be maintained at small angles. The rays with different colors illuminate the different portions of the specimen indicated by the arrows with the same colors in the specimen plane.
Figure 2748b shows typical Ronchigrams taken at the edge of an amorphous carbon film. At defoci (defined by z-height), there is a distance between the electron cross-over and the point on the specimen along the optic axis. In this case as shown in Figure 2748a (c), the Ronchigram is an image at infinite magnification with zero defocus, which looks smooth and featureless for a very thin sample. At large underfocus, electron rays at all angles cross the optic axis after the specimen and it shows a shadow image of the specimen edge. In this case as shown in Figure 2748a (b), the Ronchigram is inverted. At small underfocus, low-angle rays cross the optic axis after the specimen, while high-angle rays cross before the specimen due to spherical aberration, corresponding to the case in Figure 2748a (d). Therefore, the shadow image changes in magnification as a function of the angle. The low-angle asymmetry indicates the presence of astigmatism. In other words, at large angles, the beam must cross before the specimen, leaving a distorted shadowed image to surround the small disk of infinite magnification. Image reversals from inverted to erect must occur for all overfocus settings, leading to rings in the Ronchigram (if the probe is properly stigmated). At Gaussian focus, the lowest-angle rays cross the axis at the specimen, while higher-angle rays cross before the specimen due to the spherical aberration. The coma free axis is defined at this focus and all alignment and positioning of detectors and apertures can be performed with respect to the low-angle “disk”. Defocus and spherical aberration can effectively cancel each other at those lowest angles. Axial astigmatism can be accurately corrected by using the stigmator coils, resulting in circularly symmetric Ronchigram features. At overfocus, rays at all angles cross the axis before the specimen. In this case as shown in Figure 2748a (a), the Ronchigram (the shadow image on the viewing screen) is an erect, magnified image of the illuminated portion of the specimen with a magnification of the ratio of the camera length to the defocus (Δf).
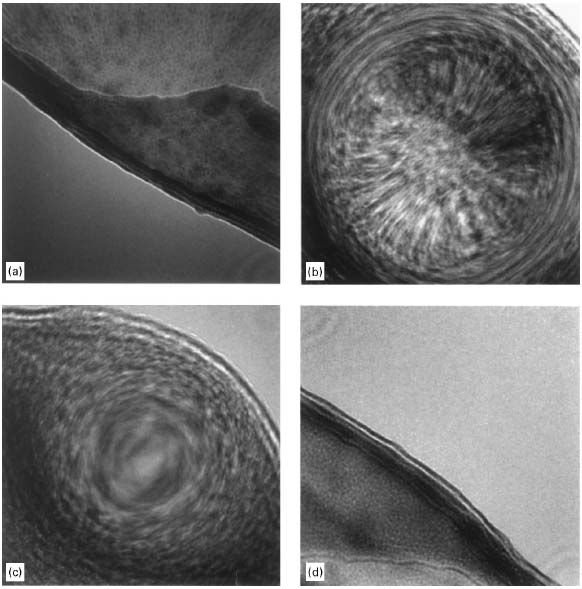
Figure 2748b. Ronchigrams of a thin amorphous carbon (C) film at: (a) Large underfocus, (b) Small underfocus, (c) Gaussian focus, and (d) Overfocus.
[1]
The Ronchigrams of a thin <110> silicon (Si) film in Figure 2748c shows the diffraction effects and fringes arising from the specimen periodicities. The visibility of the characteristic fringes depends on the precision of specimen tilt and the degree of probe coherence in a specific crystalline orientation. Figure 2748c (a) shows the Ronchigram at small underfocus. The lattice fringes are visible near the Ronchigram center and become extremely distorted at high angles because of the spherical aberration. Figure 2748c (b) shows the Ronchigram near Scherzer focus. The central fringes are large and wide. Figure 2748c (c) shows the Ronchigram at slight overfocus. The fringe spacing decreases with increasing angle from the Ronchigram center.
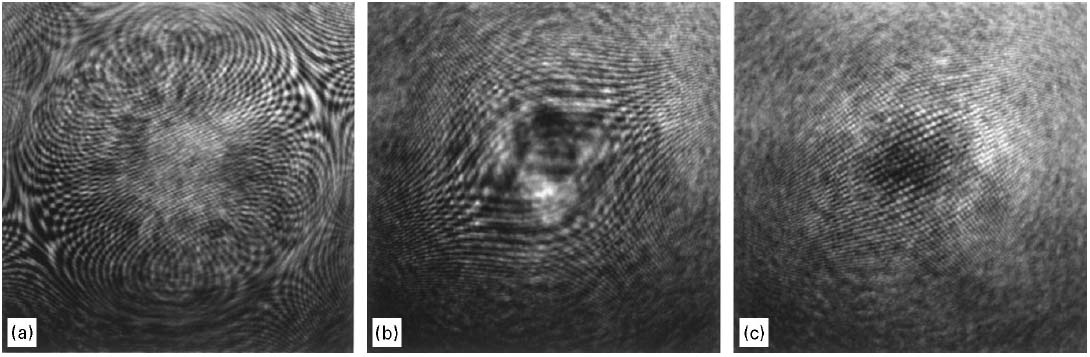
Figure 2748c. The Ronchigrams of a thin <110> Si film: (a) At small underfocus, (b) Near Scherzer focus, and (c) At slight overfocus.
[1]
Figure 2748d shows more examples of under- and over-focused Ronchigrams from an amorphous STEM film, respectively.
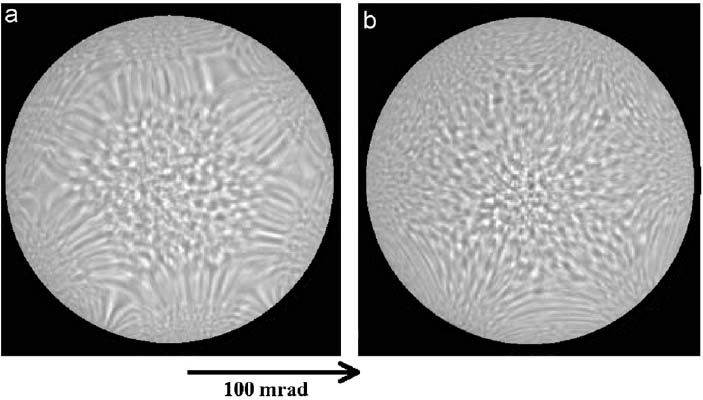
Figure 2748d. A focal series of the Ronchigrams: (a) Underfocus of 128 nm and (b) Overfocus of 128 nm.
[2]
The changes of A1 and B2 from underfocus (UF) to overfocus (OF) are shown in Figure 2748e. At focus (F), the probed area is the smallest and the image blows-up to "infinity" magnification, while the images reverses from UF to OF.
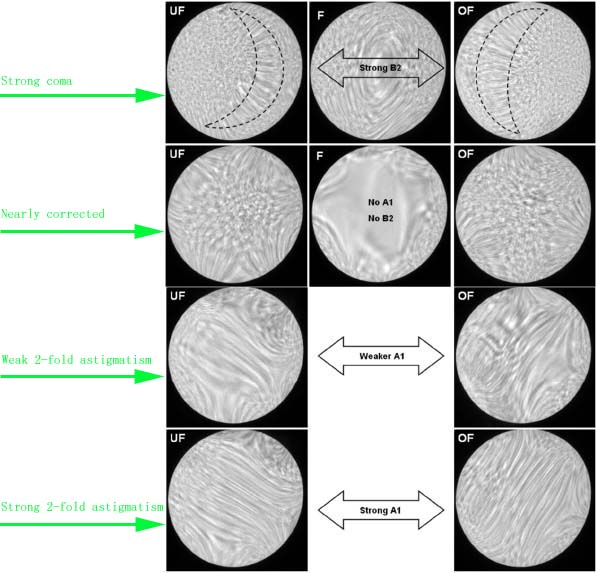
Figure 2748e. Changes of A1 and B2 from underfocus (UF) to overfocus (OF). Adapted from [3]
[1] E.M. James, N.D. Browning, Practical aspects of atomic resolution imaging and analysis in STEM, Ultramicroscopy 78 (1999) 125-139.
[2] Sawada H, Sannomiya T, Hosokawa F, Nakamichi T, Kaneyama T, Tomita T, Kondo Y, Tanaka T, Oshima Y, Tanishiro Y, and Takayanagi K (2008) Measurement method of aberration from Ronchigram by autocorrelation function. Ultramicroscopy 108: 1467–1475.
[3] FEI Application Instructions: How to tune STEM probe on Cs-corrected Titan.
|