EELS Measurement of Nickel (Ni) - Practical Electron Microscopy and Database - - An Online Book - |
|||||||||||||||||||||||||||||||||||||||||||||||||||||||||||||
| Microanalysis | EM Book http://www.globalsino.com/EM/ | |||||||||||||||||||||||||||||||||||||||||||||||||||||||||||||
Table 3430a. Main edges of Ni used in EELS analysis.
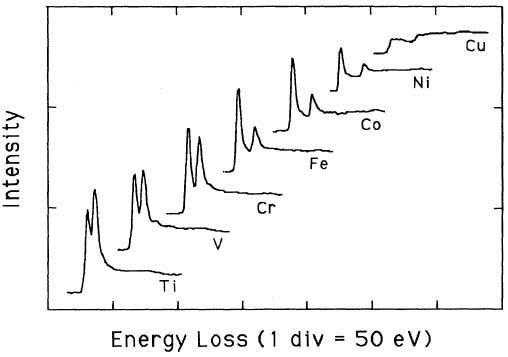
Pearson et al. [1] experimentally and theoretically (based on one-electron Hartree-Slater calculations) found that the intensities of L2,3 white lines for most of the 3d and 4d transition metals decreased nearly linearly with increasing atomic number, reflecting the filling of the d states. Figure 3430a shows the deconvoluted and background-subtracted L2,3 energy-loss spectra for the 3d transition metals. The edge energies are not shown in order to present all the spectra in the same figure, while the intensities of the white lines are scaled simultaneously for all elements.
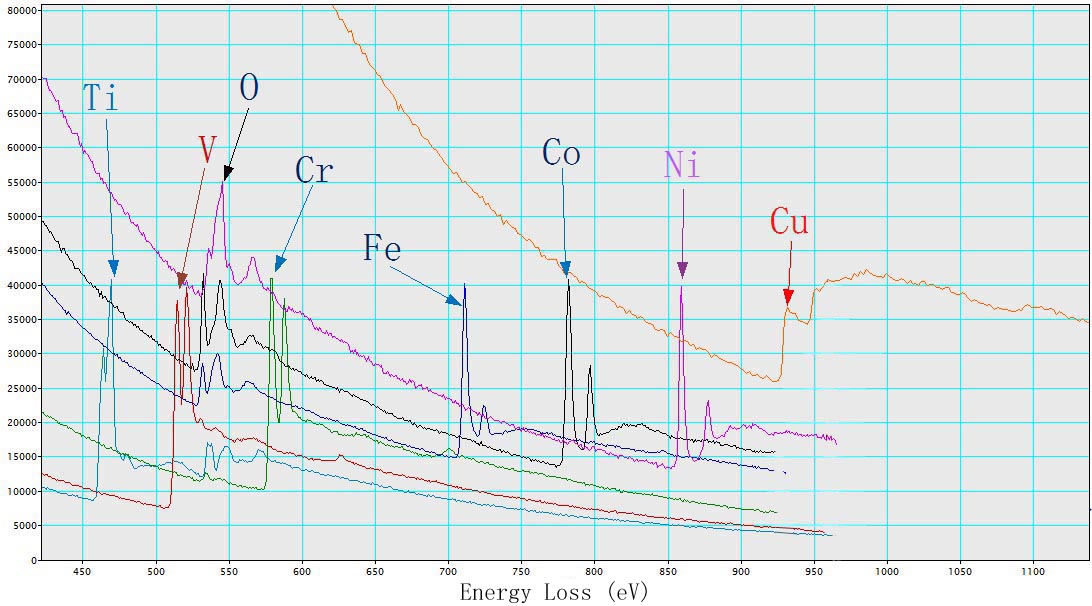
Figure 3430b shows EEL spectra of TiO2, V, Cr, Fe2O3, CoO, NiO, and Cu with L2,3 energy-losses for the 3d transition metals. The chemical shift of O element in the different oxides (TiO2, Fe2O3, CoO, and NiO) is also indicated in the figure. The main edges of Ti, V, Cr, Fe, Co, Ni and Cu, and their edge onsets are listed in Table 3430b.
Table 3430b. Main edges of Ti, V, Cr, Fe, Co, Ni, and Cu, and their edge onsets.
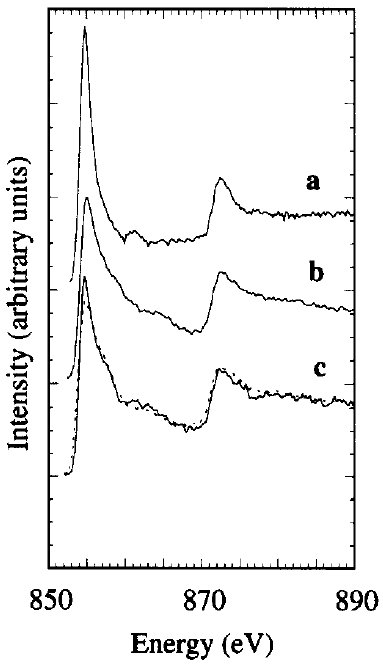
The white line intensities can be modeled as discussed in page3436. One needs to pay attention to the total number of the d holes in a single nickel (Ni) atom. A single Ni atom has 9.4 electrons in the 3d band [2 - 3]. However, due to hybridization these electrons include a small amount of 4s character such that the actual 3d character only has 8.8 electrons, contributing to the L2 and L3 absorption spectra (signal of the white lines). Ni L3 edge in NiO has a peak maximum at 853.2 eV. Figure 3430c shows the Ni-L2,3 edges for Ni, Ni2B, and Ni60B40 samples.
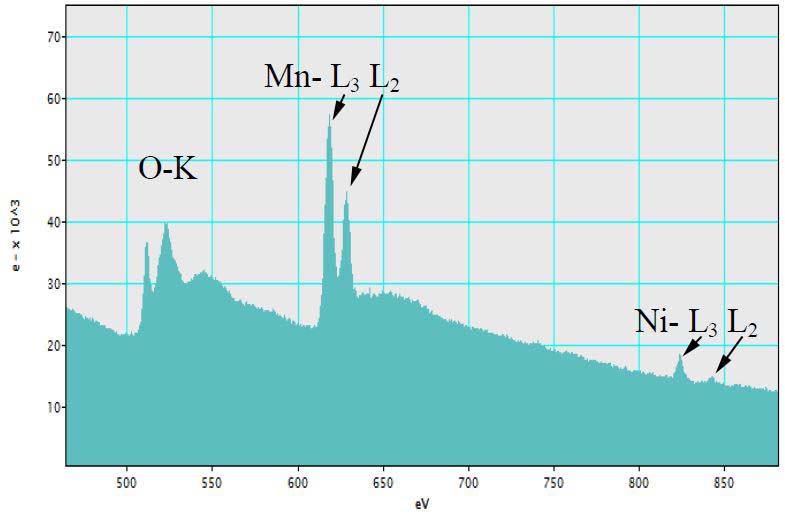
Figure 3430c. The Ni-L2,3 edges for Ni (a), Ni2B (b), and Ni60B40 (c) samples. Adapted from [4] Figure 3430d shows EELS spectrum of LiMn1.5Ni0.5O4 electrode material. The O-K , Mn-L and Ni-L edges are clearly presented.
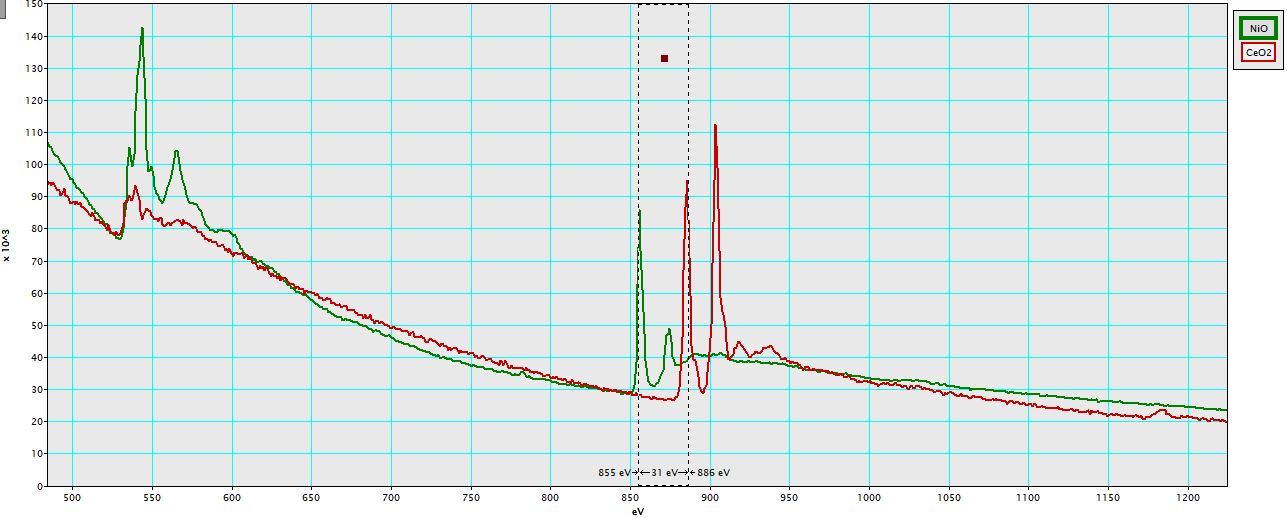
Figure 3430d. EELS spectrum of LiMn1.5Ni0.5O4 electrode material. Adapted from [6] Figure 3430e shows EEL spectra of NiO and CeO2 materials. The difference of energy loss peaks between Ni L3 peak and Ce M5 is ~31 eV.
Figure 3430e. EEL spectra of NiO and CeO2 materials. Table 3430c lists the EELS comparison between Ni2Si, NiSi, and NiSi2. Ni 2p core level shifts are also indicated. Table 3430c. EELS comparison between Ni2Si, NiSi, and NiSi2.
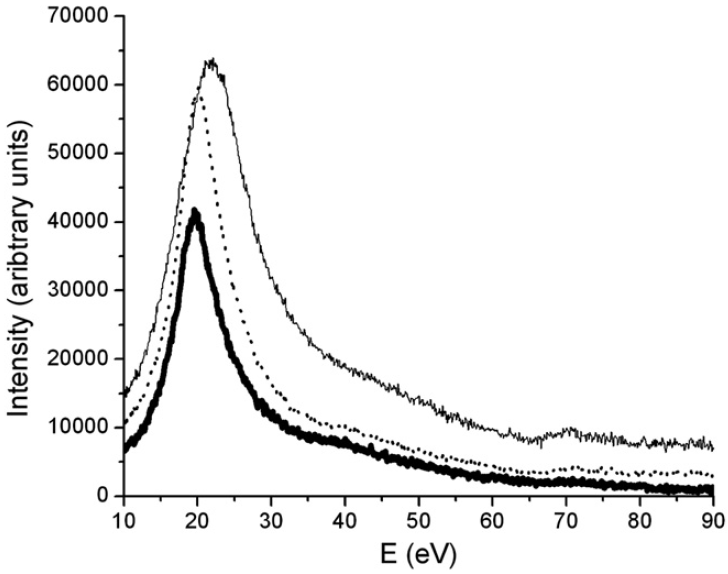
Figure 3430f shows the plasmon regions and Ni–M2,3 edges of the three nickel silicide phases in EELS. The three phases can be distinguished by their bulk plasmon energy position (Ep). The energy positions are shifted from 19.4 eV for NiSi2, to 20 eV for NiSi and 22.2 eV for Ni2Si. The Ni–M2,3 core edge shifts can also be obtained from 65.8 eV for Ni2Si and 66.8 eV for NiSi to 67.5 eV for NiSi2.
[1] D. H. Pearson, C. C. Ahn, and B.Fultz, White lines and d-electron occupancies for the 3d and 4d transition metals, Physical Review B, 47(14), (1993) 8471-8478.
|
|
||||||||||||||||||||||||||||||||||||||||||||||||||||||||||||