Sum (or Coincidence) Peaks in X-ray/EDS Profiles - Practical Electron Microscopy and Database - - An Online Book - |
|||||||||||||||||||||||||||||||||
| Microanalysis | EM Book https://www.globalsino.com/EM/ | |||||||||||||||||||||||||||||||||
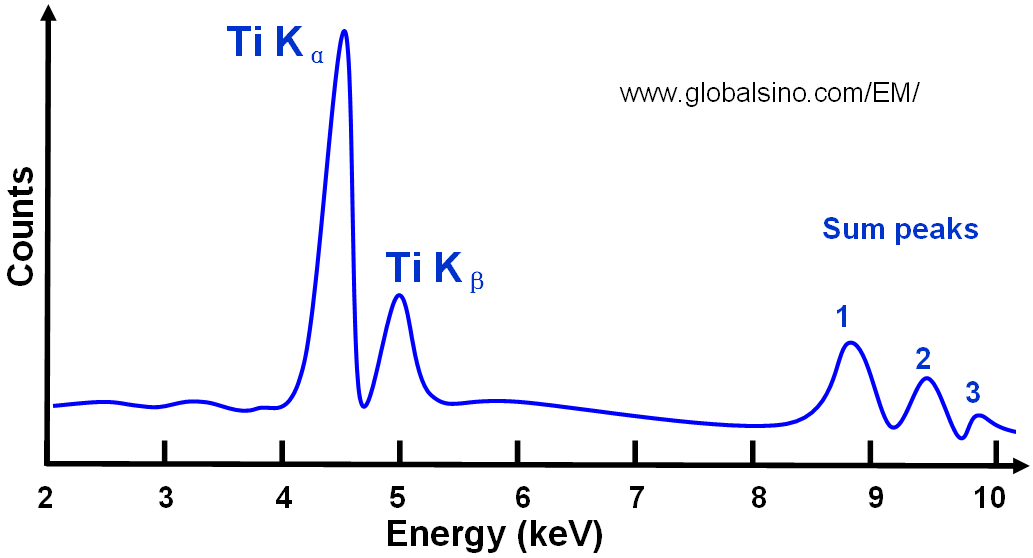
In x-ray measurements (e.g. EDS), a phenomenon, representing peak pileup, occurs where two events from high-intensity peaks arrive in the pulse processing electronic instantaneously, so that the pileup inspector cannot recognize them as two events, and thus they are not discriminated by the pulse pile-up rejection electronics, resulting in a false peak at the sum of the two X-ray energies. Therefore, the signal pulse created and measured is the sum of the two x-ray energies, forming a new peak. In other words, the pile-up develops if two or more X-ray quanta are registered within a short time interval in the detector and the fast channel of signal processing unit cannot differentiate between them any longer. Note that such sum (also called coincidence) peaks may be present occasionally, although this is not common. This specific form of peak pileup is called “sum peak”. Figure 3803a shows the schematic illustration of the most intense sum peaks of Ti, in which the top-most intense peak (1) is from the sum of two Ti Kα events. The smallest peak (3), from the sum of two Ti Kβ events is only visible when the parent peak is very intense. The sum peaks are not only obtained from the events from the same elements but also from the events from different elements. For instance, if an x-ray photon with energy of 1.74 keV is from Si Kα excitation and an x-ray photon with energy of 1.487 keV from Al Kα excitation, a peak with energy of ~3.23 KeV is read out as a sum peak.
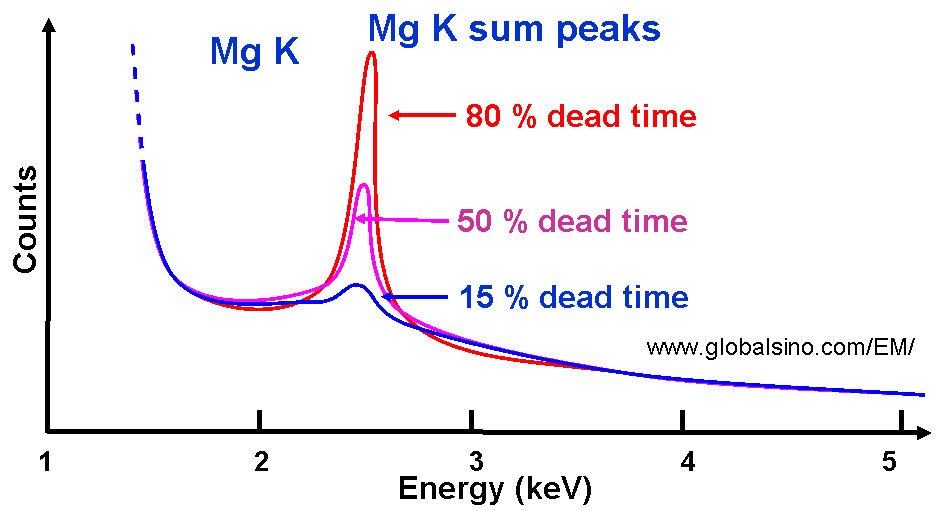
Figure 3803a. Schematic illustration of the most intense sum peaks of Ti. Figure 3803b shows the schematic illustration of dependence of sum peak intensities on different dead times.
Figure 3803b. Schematic illustration of dependence of sum peak intensities on different dead times. Table 3803 shows the effect of processing time on spectral parameters. The most important factor in avoiding the artificial sum peaks is the speed of the processor discrimination circuits. The analyst can reduce such effect by reducing the count rate and thus the X-ray signal strength. The software of many modern EDS systems is designed to recognize and flag escape and sum peaks. Table 3803. Pile up continuum and sum peaks.
The intensity of sum peak can be controlled by operating at low deadtime through the selection of the beam current |
|
||||||||||||||||||||||||||||||||