=================================================================================
Many induced factors can affect the contrast of SEM images due to the position changes of secondary electron (SE) detectors. The detector position in SEM may cause a possible voltage contact effect between sample and detector, affecting the contrast of the SEM image. On the other hand, spherical aberration of the probe-forming lens is increased with the increase of working distance, resulting in a larger electron-probe size. Therefore, the need to have better spatial resolution of SEM leads to shorten the working distance and consequently to change the SEM detector position.
The position change of the SE detectors also affects the contrast of the edges of the features at the SEM sample surface. This phenomenon is mostly induced by the variations of the generation (related to different yield of SEs for different materials) and transmission (related to different mean free path for different materials) of SEs in different materials. At the boundary of the features at the sample surface, due to edge effects the intensity of emitted SEs is not uniform and asymmetrical as shown in Figure 4851a. These non-uniform and asymmetric SE distributions contribute different number of electrons to different SE detectors in different directions with respect to the interaction volume.
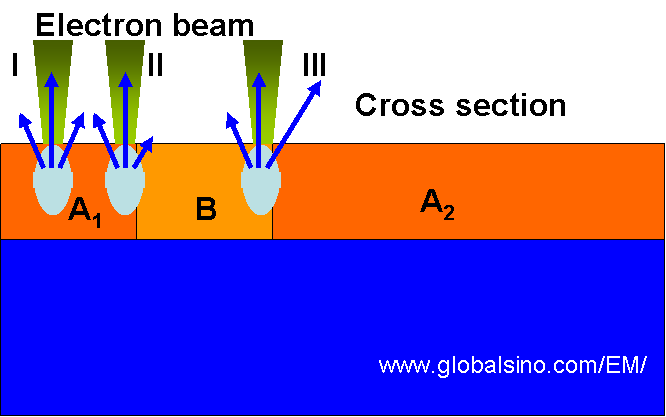
Figure 4851a. Schematic shows non-uniform and asymmetrical intensity of emitted SEs.
The position of the detectors in SEM systems also affects the image contrast. For specimens having a large topographic contrast, regions located in valleys or wells are more easily imaged using an in-lens detector than a lateral detector (e.g. Everhart-Thornley (ET) detector). Figure 4851b gives an example. The two images were taken at 1 keV with an in-lens detector (Figure 4851b (a)) and a ET detector (Figure 4851b (b)). The shadowing effects are more pronounced for lateral ET detector with respect to the in-lens detector as indicated by circle A. For small hills, the position of the ET detector introduced asymmetries in the imaging of equally inclined surfaces shown by circle B.
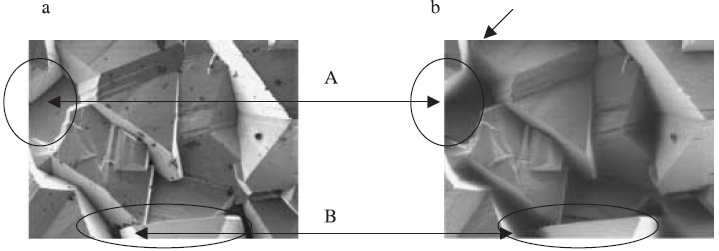
Figure 4851b. Influence of detector position on SEM images. Left image: obtained by in-lens detector; Right image: obtained by lateral ET detector.
Adapted from [1].
[1] J. Cazaux, (2005) Recent developments and new strategies in scanning electron microscopy, Journal of Microscopy, 217, 16–35.
|