If the number of the measurements is large, the distribution can be approximately given by a Gaussian distribution. For EDS and EELS techniques in EMs, if a series of measurements are repeatedly performed on a specimen, then the distribution of counts would often follow a Poisson distribution (statistics). In other words, Poisson distribution can be employed to understand how an increase in specimen thickness affects the shape of the energy loss
spectrum.
In Poisson statistics, the inelastic scattering events, or collisions, are randomly independent, which states that the occurrence of one collision does not
affect the probability of the other ones. In EM measurements, the scattering of the electrons in the sample is described by the Poisson distribution, [2]
 ----------------- [3111a] ----------------- [3111a]
where,
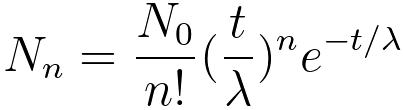
n -- the order of scattering,
N0 -- the incident electron
density per spectrum collection,
Nn -- the number of nth order
scattered electrons,
λ -- the
electron mean free path,
t -- the specimen thickness.
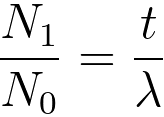
Then, the fractions of electrons experiencing n order of scattering Nn/N0 as a function of relative sample thickness t/λ can be given by,
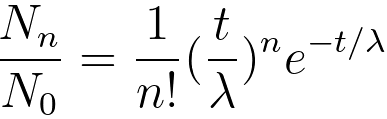 ----------------- [3111b] ----------------- [3111b]
Figure 3111 shows the fractions of electrons experiencing n order of scattering Nn/N0 as a function of relative sample thickness t/λ. For 1 order of scattering, it can be seen that the scattering intensity increases with thickness until about 1 mean free path where it reaches a maximum of 0.37 of the incident intensity and then decreases due to increasing number of electrons that undergo multiple scattering.
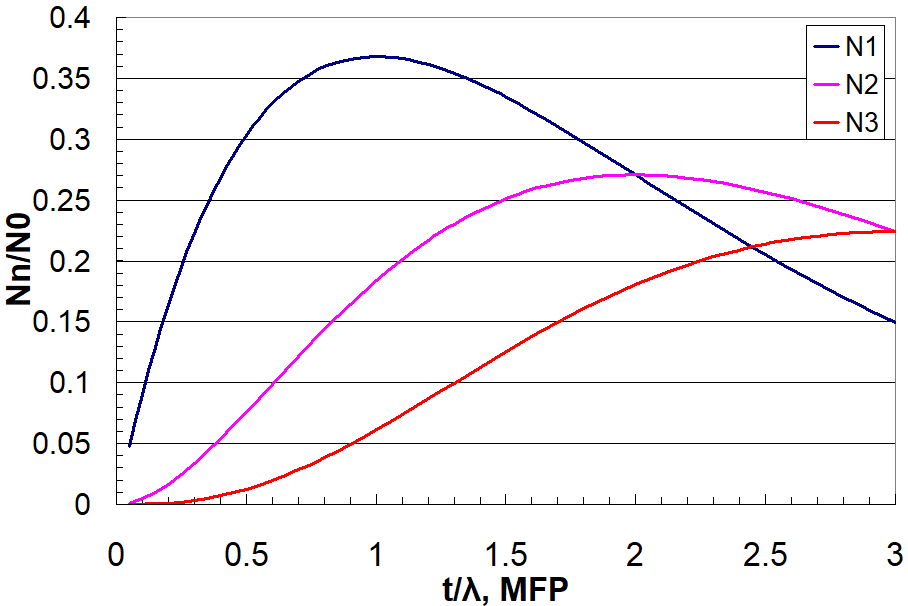
| Figure 3111. Fractions of electrons experiencing n order of scattering Nn/N0 as a function of relative sample thickness t/λ. (DM script) |
Equation 3111b can be expanded to the following equation,
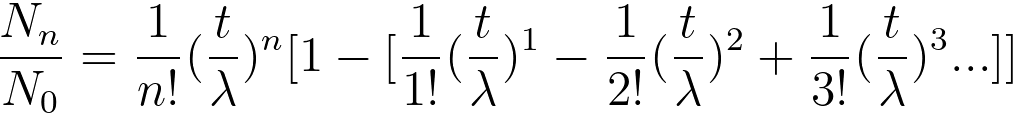 ------------------------- [3111c] ------------------------- [3111c]
In principle, when only single scattering (n = 1 in Equation 3111d) exists, then the measurement is ideal and its fraction of the single scattering is proportional to the TEM sample thickness,
 ------------------------- [3111d] ------------------------- [3111d]
However, this case described in Equation 3111d does not happen practically.
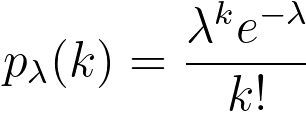
The probability pn of n plasmon-loss events (or called plasmon peak or Lorentzian peak) at a specimen
thickness, t, can be given by Poisson statistics, [8]
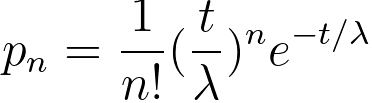 ----------------- [3111e] ----------------- [3111e]
where,
λ -- the plasmon mean free path, which is the average
distance between scattering events.
The scattering intensity associated with electrons that have suffered exactly n number of collisions is represented by In. Then, the integrated intensity
In of each plasmon peak can be given by, [8]
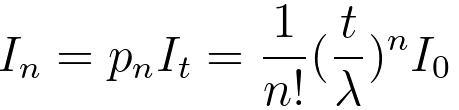 ----------------- [3111f] ----------------- [3111f]
where,
I0 -- the zero-loss intensity,
It -- the total integral of the spectrum, including I0. It
would be the incident-beam intensity in the absence of elastic scattering. In measurements, it represents
electrons that, after transmission through the specimen, are
scattered through the collection semi-angle [8] and under the spectrum, integrated up to an energy loss ~130 eV (above which further contribution from multiple scattering is
< 1% for t/λ ≤ 1.5). [9]
For a limited collection semi-angle β, as a result of a fortuitous property of the Lorentzian angular
distribution, one has, [11]
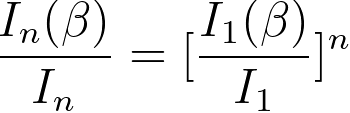 ----------------- [3111g] ----------------- [3111g]
The measured plural scattering distribution, P(E), expressed by Poisson distribution of the multiple scattering, can be given by,
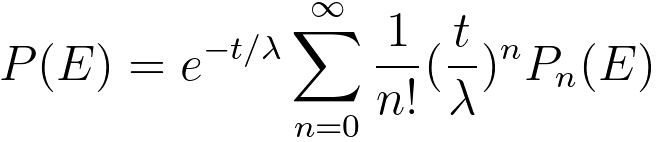 ----------------- [3111h] ----------------- [3111h]
where,
pn(E) -- the n-fold scattering distribution.
Then, the intensity of multiple scattering events, in Poisson distribution form, can be given by [1-4],
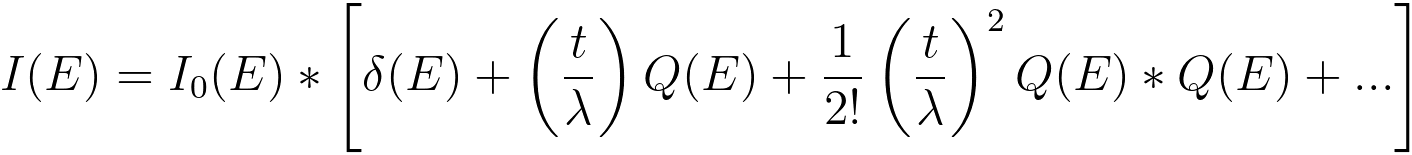 ----------------- [3111i] ----------------- [3111i]
where,
I0(E) -- the zero-loss peak intensity,
Q(E) -- the single scattering distribution normalized
to unity over all energy losses, which can be recorded by an EELS system from a thin TEM specimen,
δ(E) -- the delta-function,
* -- the asterisk stands for convolution.
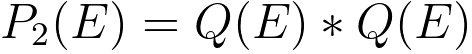
Comparing with Equations 3111e and 3111i, one can obtain pn(E),
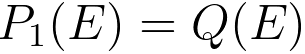 --------------------------------------------------------------------- [3111j] --------------------------------------------------------------------- [3111j]
 ---------------------------------------------------- [3111k] ---------------------------------------------------- [3111k]
 --------------------------------- [3111l] --------------------------------- [3111l]
...
The pn(E) is the n-fold self-convolution of the single scattering distribution p1(E) and results from
all preceding scattering processes,
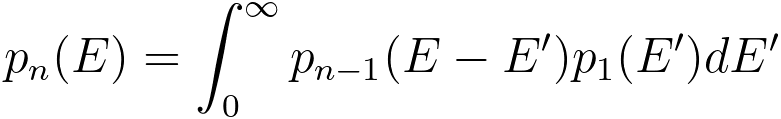 ------------------------------------------- [3111m] ------------------------------------------- [3111m]
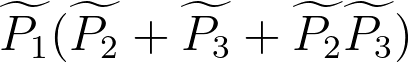
The collection aperture accepts only a fraction F1 of single inelastic scattering
and a smaller fraction Fn of each n-fold order of scattering. The various contributions to an energy-loss spectrum are classfied into four
channels: [5]
i) the unscattered distribution P0,
ii) the elastic scattering
P1,
iii) the low-loss scattering P2,
iv) the core-loss ionisation P3.
Fourier transformed unscattered distribution can be given by,
 ------------------------------------------- [3111n] ------------------------------------------- [3111n]
Then, in terms of the
Fourier transformed distributions, the final distribution of electrons at all energy losses
and scattering angles, P, can be given by, [12]
 ---------------------- [3111o] ---------------------- [3111o]
where,
 -- the elastic distribution, -- the elastic distribution,
 -- the plural energy losses, -- the plural energy losses,
 -- the multiple elastic–inelastic scattering events. -- the multiple elastic–inelastic scattering events.
Note that inelastic processes are governed by Poisson statistics; however, prediction of elastic scattering by Poisson statistics is not very accurate.
Equation 3111o represents the combination of
the single scattering distribution and the multiple low-loss
and high-loss events with the elastic distribution.
Equation 3111i can be re-written by,
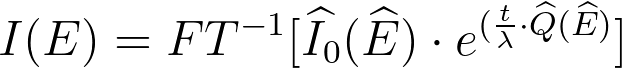 ------------------------------------------- [3111p] ------------------------------------------- [3111p]
where,
^ -- a forward Fourier transform,
FT−1 -- an inverse Fourier transform.
Then, the following equation for modeling single scattering distribution can be obtained,
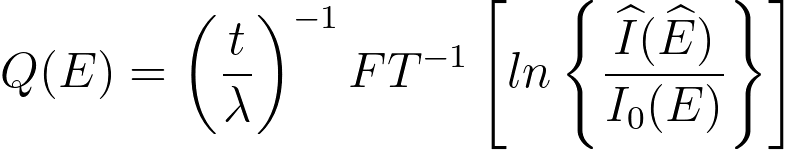 ------------------------------------------- [3111q] ------------------------------------------- [3111q]
Table 3111a. Single and multiple electron scattering.
The collection semi-angle must be large enough so that the plural scattering obeys Poisson statistics. With this satisfaction, Poisson statistics can have many applications:
i) This is an assumption of the log-ratio calculation method. A collection semi-angle of 5-10 mrad normally suffices to ensure Poisson statistics to within 10% accuracy for typical beam and edge energies. [6,7]
ii) Measurements of TEM sample thickness based on Poisson statistics of inelastic scattering (see page4621).
The inevitable presence of noise in EELS spectra is
mainly governed by Poisson statistics since the collection of an EELS spectrum
is essentially a counting process of incoming, inelastic electrons. [10] As a result of such noise, EELS spectra made under
the same conditions will differ from experiment to experiment.
Table 3111b. Other EELS applications of Poisson distribution.
Application |
Note |
Thickness measurement |
page4621 |
Background of Poisson distribution
When a certain reaction happens randomly in time with an average frequency λ in a given time interval, then the number k of reactions in that time interval will follow a Poisson distribution,
 ----------------------------------- [3111r] ----------------------------------- [3111r]
which has the characteristic function:
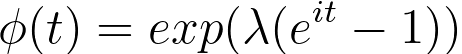 ----------------------------------- [3111s] ----------------------------------- [3111s]
Then, we have,
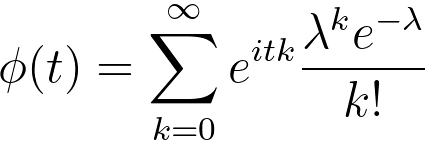 ----------------------------------- [3111t] ----------------------------------- [3111t]
The Poisson distribution can be considered as the limiting case of a binomial distribution with np = λ, where n approaches infinity (n → ∞) and, at the same time, p approaches zero, p → 0
Additional learning: Application and validation of Poisson statistics
Question 1:
A student receives, on average, 8 text messages in a 3 hour period.
i) What is the probability that the student will receive exactly 10 text messages in a 3 hour period?
ii) What is the probability that the student will receive exactly 28 test messages in a 9 hour period?
Answer:
i) The probability is given by,
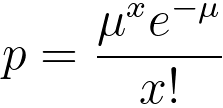 ----------------------------------- [3111r] ----------------------------------- [3111r]
The time interval is the same (3 hours); therefore, the mean µ is 8 and x is 10. Then, the obtained probability is,
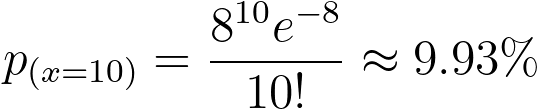 ----------------------------------- [3111s] ----------------------------------- [3111s]
ii) The new time period is obtained by multiplying the original time period by 3; therefore, the new mean is also obtained by multiplying the original mean by 3, which gives new mean µnew = 24. Therefore, the probability is given by,
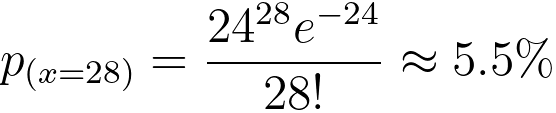 ----------------------------------- [3111t] ----------------------------------- [3111t]
[1] Batson PE, Silcox J. Phys Rev B 1983;27:5224.
[2] Egerton, RF. Electron Energy Loss Spectroscopy. 2. Plenum Press; New York: 1996.
[3] Leapman, RD. Transmission Electron Energy Loss Spectrometry in Materials Science and the EELS
Atlas. 2. Ahn, C., editor. Wiley-VCH; Berlin: 2004. p. 49 Chapter 3.
[4] Leapman RD, Swyt CR. Ultramicroscopy 1988;26:393.
[5] D. S. Su and E. Zeitler, Background problem in electron-energy-loss
spectroscopy. Phys. Rev. B 47, 14 734–14 740 (1993).
[6]
R.F. Egerton and S.-H. Liou, "A remarkable property of the angular distribution of plural inelastic
scattering, with benign consequences for the deconvolution of electron energy-loss spectra," Proc.
of the 47th Ann. EMSA Meeting, (1989) 380.
[7] R.F. Egerton and Z.L. Wang, "Plural-scattering deconvolution of electron energy-loss spectra
recorded with an angle-limiting aperture", Ultramicroscopy, 32 (1990) 137.
[8] R. F. Egerton, Electron energy-loss spectroscopy in the TEM, Rep. Prog. Phys. 72 (2009), 016502, pp25.
[9] R. F. Egerton, The Range of Validity of EELS Microanalysis Formulae, Ultramicroscopy 6 (1981) 297-300.
[10] J. Verbeeck and S. Van Aert, Model based quantification of EELS spectra, Ultramicroscopy 101 (2004) 207–224.
[11]
Egerton, R.F. (2011) Electron Energy-Loss Spectroscopy in the Electron Microscope, 3rd Edition
(Springer, New York).
[12] M.K.H. Natusch, C.J. Humphreys, N. Menon, O.L. Krivanek, Experimental and theoretical study of the detection limits in electron energy-loss spectroscopy, Micron 30 (1999) 173–183.
|