|
This book (Practical Electron Microscopy and Database) is a reference for TEM and SEM students, operators, engineers, technicians, managers, and researchers.
|
=================================================================================
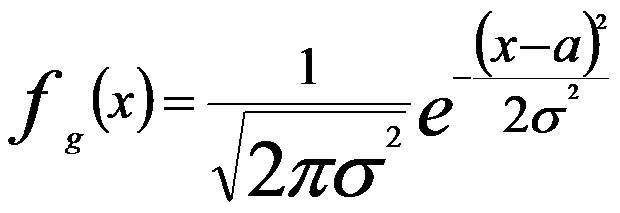
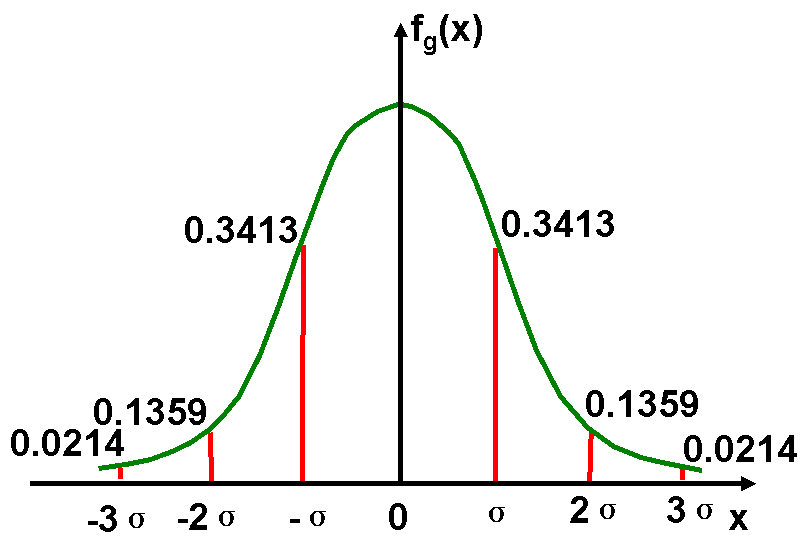
Since the number of electrons in the incident electron beam is very large, the Gaussian distribution function is normally used to describe the physical events. The Gaussian distribution is also commonly called the "normal distribution" and is often described as a "bell-shaped curve". The Gaussian distribution is a continuous function which approximates the exact binomial distribution of events. The Gaussian distribution is normalized so that the sum over the cross section of the electron beam gives a probability of 1, as shown in Figure 4627, and Gaussian distribution function is given by,
 ---------- [4627a] ---------- [4627a]
where σ is standard deviation, and a the mean. The mean value is a = np where n is the number of events and p the probability of any integer value of x (this expression carries over from the binomial distribution). The full width of the Gaussian curve at half the maximum (FWHM) is given by,
 ------------- [4627b] ------------- [4627b]

Figure 4627. Schematic plot of Gaussian distribution.
Note that the 1, 2, and 3 standard deviation intervals correspond to 68%, 95%, and 99% of the observations.
For EDS and EELS techniques in EMs, if a series of measurements are repeatedly performed on a specimen, then the distribution of counts would often follow a Poisson distribution. If the number of the measurements is large, the distribution can be approximately given by a Gaussian distribution. In this case, Figure 4627 states 68% confidence level at ±1σ, 95% confidence level at ±2σ, and 99% confidence level at ±3σ. For instance, the peaks in the X-ray spectra, detected by the EDS detector, are described by Gaussian distribution,
 ---------------- [4627] ---------------- [4627]
where,
Ec -- The energy at the center of the peak,
Ei -- The energy at the ith channel,
Yi -- The amplitude in the ith channel,
Ac -- The amplitude at the center of the peak,
γ -- The 1/2*FWHM (full width at half maximum).
|
 ---------- [4627a]
 ---------------- [4627]