EELS Measurement of Copper (Cu) - Practical Electron Microscopy and Database - - An Online Book - |
|||||||||||||||||||||||||||||||||||||||||||||
| Microanalysis | EM Book https://www.globalsino.com/EM/ | |||||||||||||||||||||||||||||||||||||||||||||
Table 3431a. Main edges of Cu used in EELS analysis.
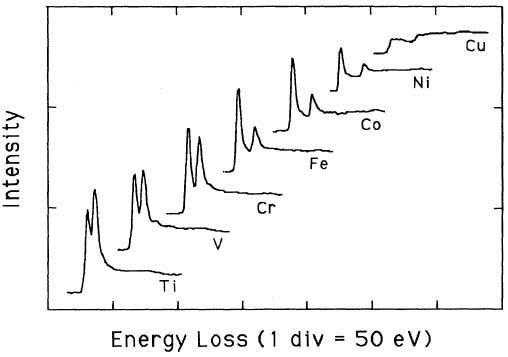
Pearson et al. [1] experimentally and theoretically (based on one-electron Hartree-Slater calculations) found that the intensities of L2,3 white lines for most of the 3d and 4d transition metals decreased nearly linearly with increasing atomic number, reflecting the filling of the d states. Figure 3431a shows the deconvoluted and background-subtracted L2,3 energy-loss spectra for the 3d transition metals. The edge energies are not shown in order to present all the spectra in the same figure, while the intensities of the white lines are scaled simultaneously for all elements. Metallic Cu does not have these two L3 and L2 lines since its d-band is fully occupied, while all the other transition elements from Ti (22) to Ni (28) have clearly.
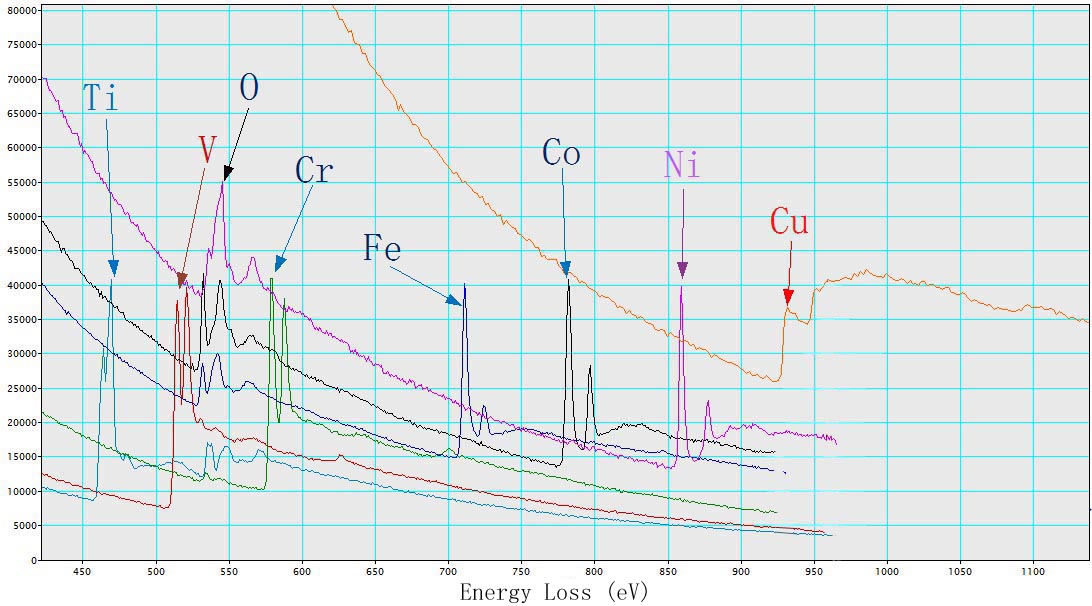
Figure 3431b shows EEL spectra of TiO2, V, Cr, Fe2O3, CoO, NiO, and Cu with L2,3 energy-losses for the 3d transition metals. The chemical shift of O element in the different oxides (TiO2, Fe2O3, CoO, and NiO) is also indicated in the figure. The main edges of Ti, V, Cr, Fe, Co, Ni and Cu, and their edge onsets are listed in Table 3431b.
Table 3431b. Main edges of Ti, V, Cr, Fe, Co, Ni, and Cu, and their edge onsets.
The spectrum of elemental copper has no white lines because of its fully occupied 3d band as shown in Figure 3431c.
Figure 3431d compares the EELS profiles taken from a grain boundary and a grain bulk of perovskite-type CaCu3Ti4O12 (with grain sizes of 100-300 µm). Based on HRTEM imaging, it was suggested that the grain boundary exhibited a step-like morphology and high local stress due to the change of chemistry and/or structure. The bulk EEL data suggested that Cu was divalent, while the EEL data for the grain boundary suggested that Cu became mixed valence. Furthermore, the grain boundary was Cu rich, which was determined by EDS measurements.
[1] D. H. Pearson, C. C. Ahn, and B.Fultz, White lines and d-electron occupancies for the 3d and 4d transition metals, Physical Review B, 47(14), (1993) 8471-8478.
|
|
||||||||||||||||||||||||||||||||||||||||||||