
Chapter/Index: Introduction | A | B | C | D | E | F | G | H | I | J | K | L | M | N | O | P | Q | R | S | T | U | V | W | X | Y | Z | Appendix
|
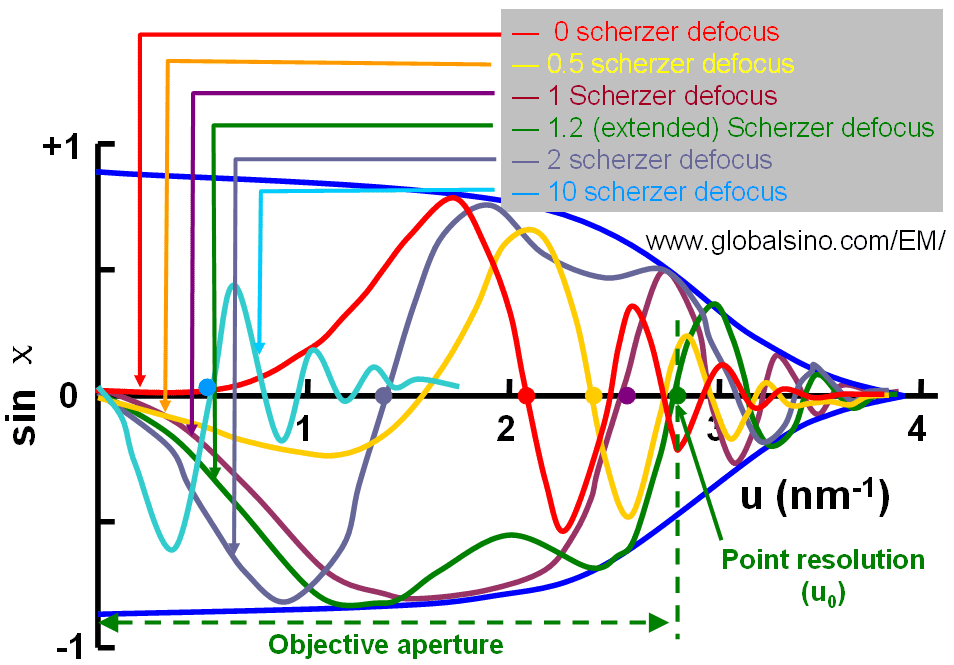
The point resolution represents the smallest detail that can be interpreted directly from the EM images assuming that the specimen is thin and that the defocus is adjusted to Scherzer defocus [1]. The point resolution, determined by Cs and the wavelength λ, is given by the Scherzer expression d0 = 0.66 Cs1/4 λ3/4. Based on CTF (contrast transfer function) theory, the point resolution of a microscope is defined as the spatial frequency where the CTF crosses the |g|-axis for the first time. Figure 4262a shows the schematic illustration of CFT T(|g|) = sin(χ) at n Scherzer defoci, given by, where, n -- 0, 0.5, 1, 1.2 (extended), 2, and 10
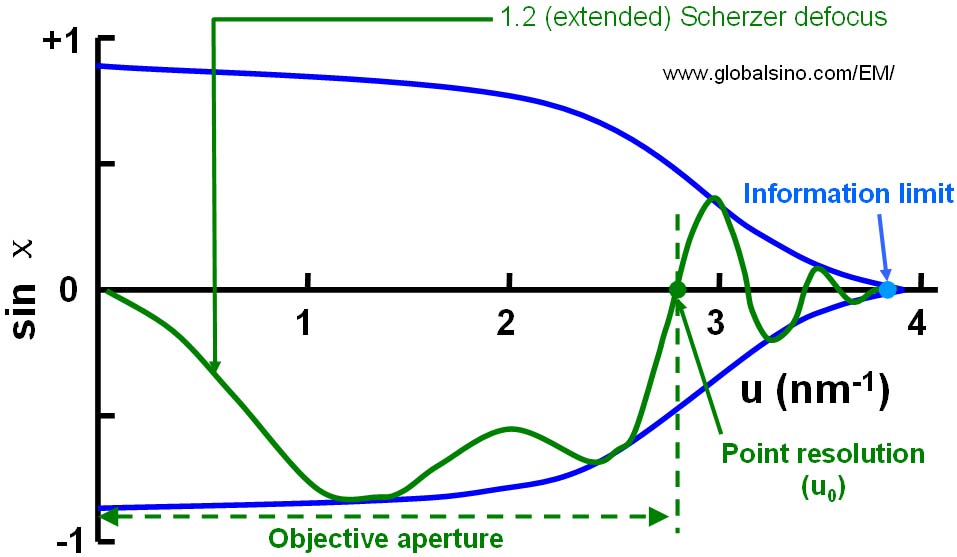
Figure 4262a. Contrast transfer function (CFT) at 0, 0.5, 1, 1.2 (extended), 2, and 10 The optimum point resolution u0 in Figure 4262a is also known as the instrumental resolution limit. The information beyond this point resolution is difficult to access because of the contrast reversals in the phase contrast transfer function (PCTF). Figure 4262b illustrates the difference between the point resolution and information limit in TEMs.
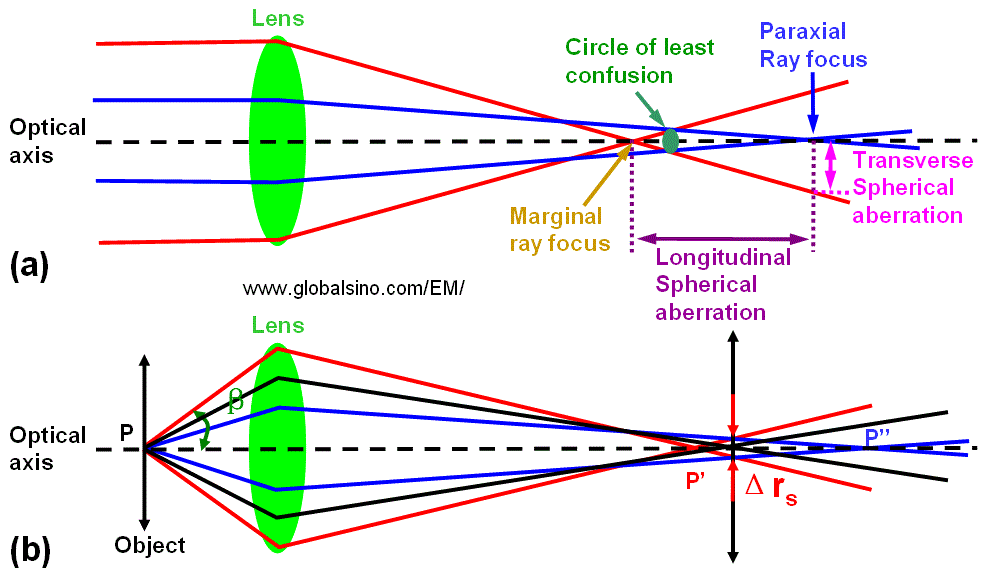
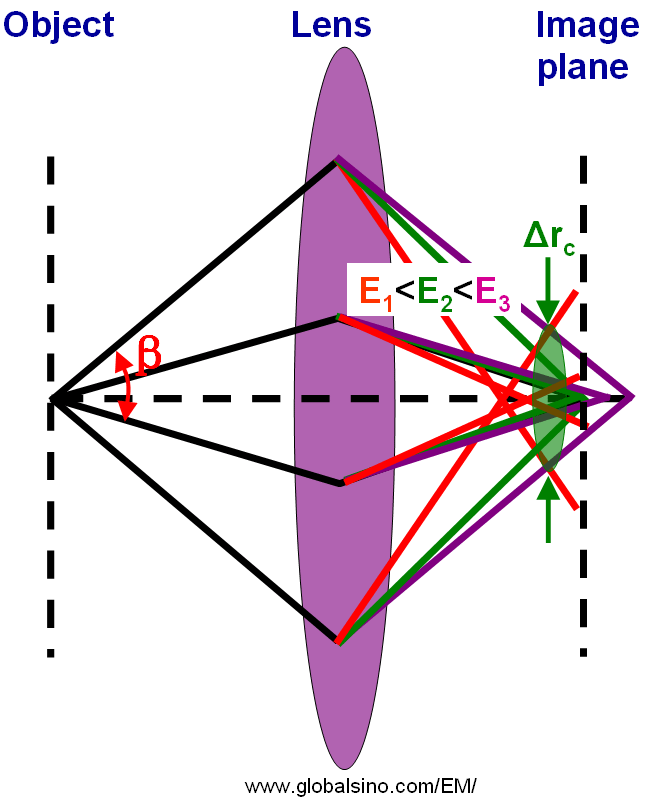
Figure 4262b. Schematic illustration of the difference between the point resolution and information limit in TEMs. With the introduction of a Cs-corrector [2], the dependence of spatial coherence on beam convergence reduces significantly and may even be eliminated completely at Cs = zero. In that case, the point resolution is equal to the information limit. The other first crossings of the u-axis at different defoci also define the point resolutions of different measurements, but they are not the optimum one and cannot represent the point resolution of the microscope. For real TEMs, the phase contrast transfer function is limited by a number of factors: i) Variation in electrical currents in the lenses; ii) Variation in accelerating voltage and gun emission; iii) Attenuation in the CCD camera; iv) Slightly nonparallel illumination; and v) Specimen drift and vibration. All these limits can be described by envelope functions, E, which will gradually dampen the phase contrast transfer function and eventually reduce it below the noise at some spatial frequency. The first three factors depend on the inherent properties of the microscope. For all modern microscopes this significant decrease happens at higher spatial frequencies than the point to point resolution and defines the information limit of the microscope beyond which no information is transferred at all. In Figure 4262c (a), the parallel light or electrons passing through the periphery of the lens are focused more strongly than those passing through the centre and the circle of the least confusion (the best focus point) is located within the range of longitudinal spherical aberration. On the other hand, in Figure 4262c (b) the electrons leaving the point P of the object are refocused at the circle of the least confusion between P' and P'' instead of P' or P''. Consequently, in the image plane the point is imaged as a disk with radius (Δrs) given by, where, Therefore, the point resolution deteriorates with increasing β.
Figure 4262c.
Schematic diagram of
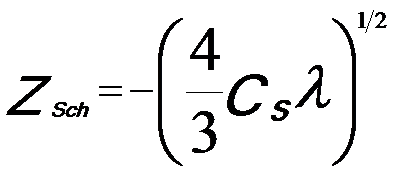
spherical aberration (SA): (a) Focusing Practically, the large, and positive third-order spherical aberration is combined with a optimized defocus setting (namely, sample height Z = C1,0) to form the Scherzer λ/4 phase plate, So that the point resolution is, In this case, the object information up to a spatial frequency 1/dSch is transferred with the same sign of the aberration function, yielding dark-atom contrast for a TEM specimen that can satisfy weak phase object approximation (WPOA) condition. Similar to the discussion regarding different accelerating voltages (the focal length at low accelerating voltages is much smaller than that at high accelerating voltages), for chromatic aberration, the light or electrons of different wavelength (or different energy E) are focused differently as shown in Figure 4262d. Different color represents different wavelength or energy of rays (light or electrons). There exists a point called the circle of least confusion, where chromatic aberration can be minimized and where the image plane locates.
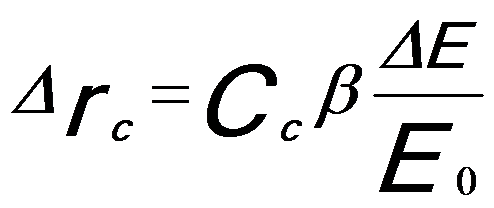
Figure 4262d. Schematic diagram of chromatic aberration. In the case of chromatic aberration, the radius (Δrc) of the circle of least confusion can be given by, The Cc coefficient is approximately equal to the focal length.
Equation 4262e indicates that the image of a single point will be a disk in the radius of Δrc, which limits the spatial resolution of the microscope.
For a modern uncorrected 300-kV TEM with Cs = 0.6 mm and an information limit of 0.1 nm, the actual point resolution is only 0.17 nm and the smallest delocalization is up to even 1.2 nm! [3] Lichte defocus of least confusion minimizes contrast delocalization, however, the strong spherical aberration under this condition induces the poor point resolution and the contrast reversals in the entire frequency range. For modern median voltage TEMs, the Scherzer point resolution is lower than the information limit, which is controlled by the temporal coherence of the electron source.
[1] O.Scherzer, The theoretical resolution limit of the electron microscope, Journal of Applied Physics 20 (1949) 20–28.
|
 ---------------------------- [4262c]
 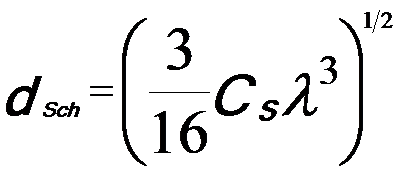 ---------------------------- [4262d]
 --------------------- [4262e]