EDS/X-rays of Iron (Fe) - Practical Electron Microscopy and Database - - An Online Book - |
||||||||||||||||||||||||||||||||||
| Microanalysis | EM Book https://www.globalsino.com/EM/ | ||||||||||||||||||||||||||||||||||
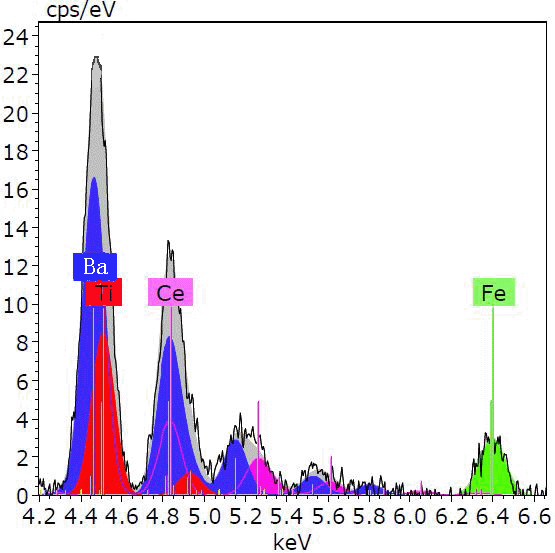
It is better to use the k factors with Fe as the standard, namely kAFe, instead of kASi, for elemental evaluations because of two reasons. Firstly, the error of the detected Si x-ray intensity, due to Si Kα absorption in the specimen, is larger than that of Fe Kα. Secondly, the EDS detector is almost 100% efficient for the detection of Fe Kα X-ray, while for Si Kα x-ray the detection efficiency is significantly degraded due to x-ray absorption in the detector itself. Figure 3779 shows a deconvoluted X-ray spectrum taken from a material containing Ba, Ti, Ce, and Fe elements. The different colored peaks represent the contribution of the various elements. The grey area is the background corrected spectrum which is the sum of all the deconvoluted lines.
On the other hand, in practice, Fe X-rays are also generated from SEM/TEM specimen chamber, column and apertures by Rutherford backscattered electrons because these parts of the SEM/TEM systems contain such element. These spurious X-rays can often be detected by the EDS detector. EDS-TEM specimen holders and stray aperture are normally used to reduce such spurious X-rays. With automatic elemental identification of NSS software, Ce cannot be identified. Instead, the software incorrectly suggests Ti, Fe, Co, Os, and Pb everywhere in elemental maps. As discussed on page4650, X-ray absorption is a function of the energy of X-rays. Low energy peaks will be more strongly absorbed than high energies ones. For thick TEM samples, k-factor correction due to X-ray absorption is needed in order to accurately quantify EDS measurements. Table 3779 lists Fe-examples of thicknesses at which the thin-film approximation is no longer valid due to X-ray absorption effects in specific materials.
[1] T. Salge, R. Neumann, C. Andersson, M. Patzschke, Advanced Mineral Classification Using Feature Analysis and Spectrum Imaging with EDS, 23rd International Mining Congress & Exhibition of Turkey, 16-19 April, 357, 2013. |
|
|||||||||||||||||||||||||||||||||
