=================================================================================
The information limit for HRTEMs is the inverse of the maximum spatial object frequency. The information limit is often obtained from measurements of diffractogram or from Young’s fringes provided a weak phase object scattering beyond the inverse of the information limit. However, for some advanced TEMs, e.g. for aberration corrected TEMs, with an smaller information limit in the sub-ångstrom range, weak phase objects are no longer applicable since they do not scatter sufficiently in this range and thus, one relies on more strongly scattering objects such as objects of heavy atoms observed along a low crystalline index zone axis. In that case, the dynamical scattering in heavy atoms becomes important such that both the non-linear and linear interaction may be important [1]. The information limit depends on the damping envelope incorporating partial temporal coherence due to chromatic aberration, but not partial spatial coherence due to beam convergence.
With the introduction of a Cs-corrector [2], the dependence of spatial coherence on beam convergence reduces significantly and may even be eliminated completely at Cs = zero. In that case, the point resolution is equal to the information limit. However, for a modern uncorrected 300-kV TEM with Cs = 0.6 mm and an information limit of 0.1 nm, the actual point resolution is only 0.17 nm and the smallest delocalization is up to even 1.2 nm! [5]
For modern median voltage TEMs, the Scherzer point resolution is lower than the information limit, which is controlled by the temporal coherence of the electron source.
If we take e-2 as the cut-off value, the information limit due to chromatic aberration is given by [3],
 --------------------- [4156a] --------------------- [4156a]
where,
Δ --- The defocus spread, expressed in terms of the standard deviation.
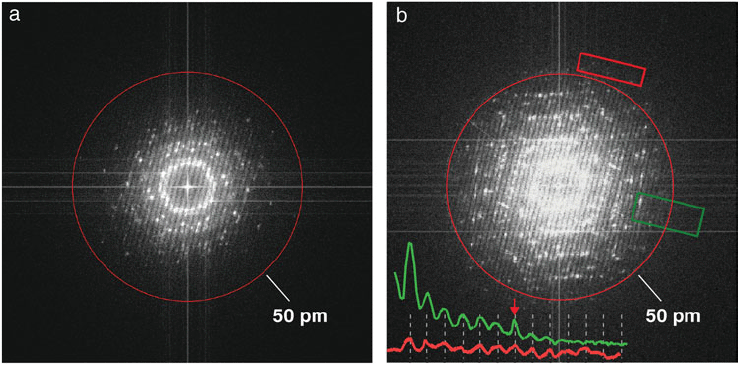
The extent of information transfer and the spatial resolution can be calculated by frequency space obtained from Young’s fringes produced by an image shift during imaging exposure. Figure 4156 shows the Fourier transforms of HRTEM (high-resolution TEM) images of gold (Au) nanoparticles on an amorphous carbon film. A monochromator was installed in the TEM system. When the monochromator was turned off, the Young’s fringes extended only to about 70 pm. When the monochromator was turned on and thus the effect of chromatic aberration was reduced, the Young’s fringes extended beyond 50 pm (red circle) in all directions, reflecting that this microscope with the monochromator has 50 pm spatial resolution.

Figure 4156. HRTEM performance demonstrated by Young’s fringe experiments with gold nanoparticles on a carbon film: (a) With monochromator turned off, the Young’s fringes extended to about 70 pm; (b) With monochromator turned on, the Young’s fringes extended beyond 50 pm. The inset line traces are obtained from the areas outlined in green and red boxes [4].
If the spherical aberration (Cs) is zero in a Cs-corrected microscope, positive phase contrast of a weak-phase object can still be obtained by the defocus,
 ----------------------------------- [4156b] ----------------------------------- [4156b]
This condition presents a pass band up to the information limit (gmax) at the contrast delocalization of R0 = 1/gmax.
In STEM, the fluctuations in accelerating voltage or the current flow in the probe-forming electromagnetic lenses contributes to the chromatic aberration that leads a cutoff to the highest spatial frequency. In HRTEM, the cut-off frequency corresponds to the information limit. The high-tension power supply and beam-current in modern electron microscopes can achieve 10-7 stability so that the main source of the chromatic aberration is due to energy spread of the electrons within the probe.
[1] Van Aert S, Chen JH, Van Dyck D., Linear versus non-linear structural information limit in high-resolution transmission electron microscopy, Ultramicroscopy, 110(11) (2010) 1404-10.
[2] Rose, H., Outline of a spherically corrected semiaplanatic medium-voltage transmission electron microscope, Optik, 85 (1990) 19–24.
[3] Spence, J. C. H., Experimental High-Resolution Electron Microscopy, seconded., Oxford University Press, NewYork, 1988.
[4] C. Kisielowski, B. Freitag, M. Bischoff, H. van Lin, S. Lazar, G. Knippels, P. Tiemeijer, M. van der Stam, S. von Harrach, M. Stekelenburg, M. Haider, S. Uhlemann, H. Müller, P. Hartel, B. Kabius, D. Miller, I. Petrov, E. A. Olson, T. Donchev, E.A. Kenik, A. R. Lupini, J. Bentley, S.J. Pennycook, I. M. Anderson, A.M. Minor, A.K. Schmid, T. Duden, V. Radmilovic, Q. M. Ramasse, M. Watanabe, R. Erni, E.A. Stach, P. Denes, and U. Dahmen, Detection of single atoms and buried defects in three dimensions by aberration-corrected electron microscope with 0.5-Å information limit, Microsc. Microanal. 14, 469–477, 2008.
[5] Markus Lentzen, Progress in Aberration-Corrected High-Resolution
Transmission Electron Microscopy Using Hardware Aberration Correction, Microsc. Microanal. 12, 191–205, 2006.
|
 --------------------- [4156a]
 ----------------------------------- [4156b]