=================================================================================
In general, the thin-film criterion is satisfied if there is no significant absorption or fluorescence (namely, both are less than 5%). In this case, the sample is normally less than 500 nm in thickness. However, it should be highlighted that the thin-film criterion is an approximation but it does not mean that there is no absorption or fluorescence at all. The weak absorption and fluorescence still can affect the accuracy of elemental quantification.
The count of X-ray acquisition can be increased mainly by:
i) Increase of acquisition time. The acquisition time may be increased if we have good stability of specimen stage and drift-correction software is used.
ii) Increase of solid angle of EDS detector.
iii) Thicker TEM specimens or SEM specimens are used. However, there are some drawbacks if such specimens are used.
However, it is necessary to highlight that except for the random errors from counting statistics, some factors, however, will contribute systematic errors. Those factors are mainly:
i) The accuracy of the chemical composition of the standard (if calibration or correction of kAB factors is applied).
ii) The presence of spurious X-rays.
iii) The inaccuracy of evaluation of the specimen thickness.
iv) The deconvolution of overlapping peaks.
v) Thee background-fitting routine.
In EDS measurements, the intensities of the X-ray peaks from various elements are determined by the factors below:
i) The path and energy of the incident high-energy electrons penetrating through the specimen.
ii) The ionization cross-sections of the elements.
iii) The X-ray yields.
iv) The collection probabilities of emitted X-rays (collected by the EDS detector).
All these factors above are constant for each particular characteristic X-ray if the thin film approximation is satisfied. Therefore, within this thin-specimen limit, the intensities of the peaks in EDS spectra increase with increase of specimen thickness, but the ratios of peak intensities remain unchanged if the elemental concentrations are constant. In this case, for a thin specimen, the absorption of the emitted X-ray is negligible so that the Cliff-Lorimer equation with kAB factor can be used and corrected, which depends only on the measurement conditions and on both the elements A and B, but not on the composition of the specimen.
However, for thick specimens, the peak intensity ratios change due to a couple of reasons (e.g. X-ray absorption) and thus corrections are needed to obtain accurate quantifications. In this case, the measured X-ray intensities are modified by the composition of the specimen matrix so that three additional effects need to be taken into account and to be corrected:
i) Atomic number effect (Z).
Because of the dependence of deceleration of the primary electron beam on the atomic number due to energy loss, its penetration range into the specimen is Z-dependent. For the same reason, the X-ray intensities also depend on Z.
ii) Absorption effect (A).
Due to this effect, the measured X-ray intensities are a function of the escape depth and of the absorption characteristics of the specimen. Especially, for the specimens with higher Z and the X-rays at lower energies, this correction becomes even more important.
iii) Fluorescence effect (F).
This effect causes the measured X-ray intensities of low-Z elements (with low energy X-rays) to increase at the expense of high-Z elements (with high energy characteristic X-rays). Therefore, the concentration of the low-Z elements is overestimated, while the concentration of the high-Z elements is underestimated.
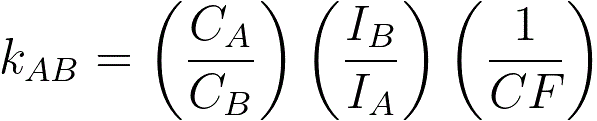
Therefore, the quantification of EDS can be given by,
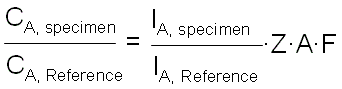 ------------------------- [3774a] ------------------------- [3774a]
where,
CA, Specimen -- The concentration of element A in the unknown specimen.
IA, Specimen -- The measured X-ray intensity from element A in the unknown specimen.
CA, Reference -- The concentration of element A in the (pure) reference specimen.
IA, Reference -- The measured X-ray intensity of element A in the reference specimen.
Normally, the EDS detector is not placed immediately above the specimen in EMs so that the take-off angle (α) in the x-ray detection system is smaller than 90° as shown in Figure 3774a. The absorption path (x) induces intensity attenuation of the x-rays emitted from the interaction volume of incident electrons with the specimen. If the absorption coefficients are different for the different analyzing elements, their intensities will be modified differently and thus, the effective k-factor will be different from the k-factor without x-ray absorption. For any set of two elements A and B, the absorption correction will be needed if:
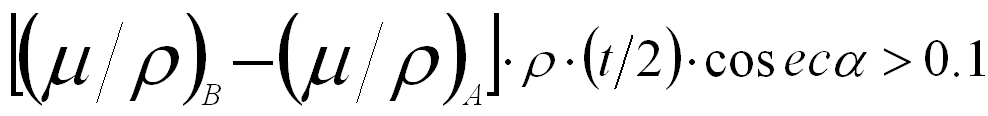 ------- [3774b] ------- [3774b]
where,
(µ/ρ)A and (µ/ρ)B -- The mass absorption coefficients of elements A and B, respectively,
ρA and ρB -- The atomic densities of the two elements,
ρ -- The atomic density of the material,
µA and µB -- The absorption coefficients of the two elements,
t -- The specimen thickness.
For two adjacent elements in the periodic table, their (μ/ρ) values are similar so that the absorption does not severely affect the ratio of the intensities of their x-ray lines.
The corrected k-factor can be given by,
 ---------- [3774c] ---------- [3774c]
where,
l -- The distance between the top surface of the specimen and the location where x-rays are emitted.
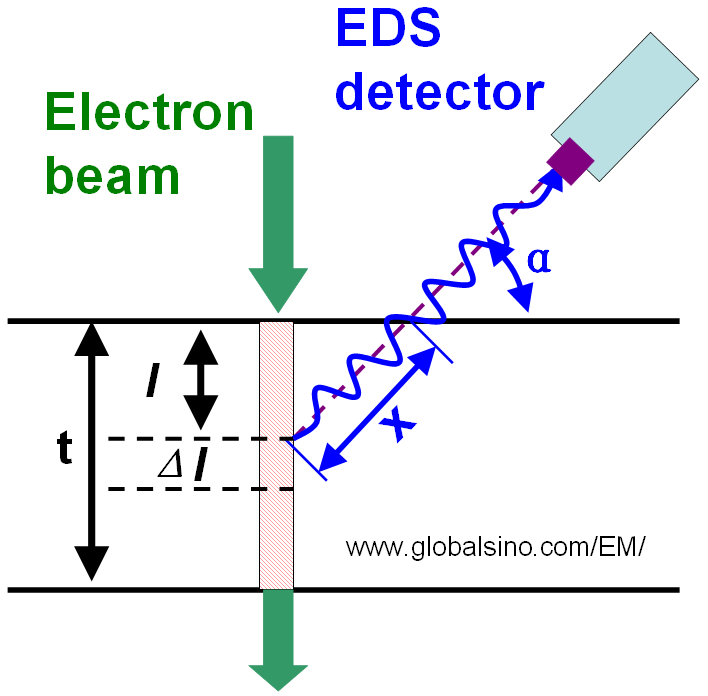
Figure 3774a. Schematic illustration of the geometry of EDS detection
as well as the absorption path (x) within the specimen.
Moreover, the k-factor should be further corrected by integrating Equation 3774c through the specimen thickness (t), given by,
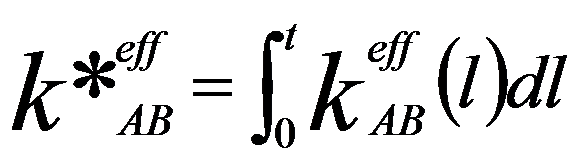 ---------- [3774d] ---------- [3774d]
However, it is not necessary to make the x-ray absorption correction if the deviation induced by x-ray absorption is significantly less than that due to the inaccuracy of intensity counting statistics.
Regarding the fluorescence effect (F), for instance, for a specimen in which the element B causes fluorescence of element A, the experimental composition need to be corrected by,
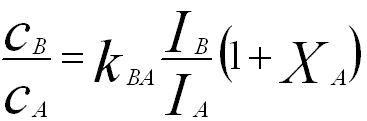 ------------------- [3774e] ------------------- [3774e]
where,
XA -- The enhancement factor for the element A.
In addition to the specimen itself, the X-ray generation process is also affected by the probe size, current, and convergence angle. Fortunately, elemental concentration quantification can be done with reasonable accuracy by comparing the peak intensities with k-factors in EDS spectra. Furthermore, in a sufficiently thin TEM specimen, the incident beam looses only a small amount of energy and the ionization cross-section is constant along the electron path. To a first approximation, X-ray absorption and secondary X-ray fluorescence within the specimen can normally be ignored.
The ZAF correction is iteratively applied until proper Z, A, and F correction factors that are consistent with the composition are found. This method can obtain an accuracy of 1 - 2% for WDS and of 5-7% for EDS, but will be worse if weak signals (low-intensity peaks) are used. It is important that both the unknown and reference specimens are measured in the same geometrical conditions of X-ray systems (e.g. distance, angle relative to detector) and all specimen structures and elements are similar.
For thick TEM samples, k-factor correction due to X-ray absorption is needed in order to accurately quantify EDS measurements. Table 3774 lists examples of thicknesses at which the thin-film approximation is no longer valid due to X-ray absorption effects in specific materials.
| Table 3774. Examples of limits to the thin-film approximation caused by X-ray absorption: Maximum thicknesses of thin specimens for
which the absorption correction (or error) is less than ±10% and ±3%. |
Material |
10% error in kAB |
3% error in kAB |
Absorbed X-ray lines |
Primary X-ray lines |
Thickness (nm) |
Al-7% Zn |
336 |
94 |
Al Kα |
Al Kα (1.486 keV) and Zn Kα(8.63 keV) |
CuAl2 |
40 |
12 |
Al Kα |
Al Kα (1.486 keV) and Cu Kα (8.04 keV) |
CuAu |
|
11 |
Cu Kα and Au Mα |
Cu Kα (8.027) and Au Lα (9.628 keV) |
NiAl |
32 |
9 |
Al Kα |
Al Kα (1.486 keV) and Ni Kα (7.471 keV) |
Ag2Al |
33 |
10 |
Al Kα and Ag Lα |
Al Kα (1.486 keV) and Ag Lα (2.984 keV) |
Ag3Al |
31 |
9 |
Al Kα and Ag Lα |
Al Kα (1.486 keV) and Ag Lα (2.984 keV) |
Fe–5%Ni |
|
89 |
Ni Kα |
Fe Kα (6.391 keV) and Ni Kα (7.461 keV) |
FeP |
|
34 |
P Kα |
Fe Kα (6.391 keV) and P Kα (2.014 keV) |
Fe3P |
|
22 |
P Kα |
Fe Kα (6.391 keV) and P Kα (2.014 keV) |
FeS |
180 |
50 |
S Kα |
Fe Kα (6.398 keV) and S Kα (2.307 keV) |
Al2O3
|
113 |
14 |
Al Kα and O Kα |
Al Kα (1.486 keV) and O Kα (0.525 keV) |
MgO |
|
25 |
Mg Kα, O Kα |
Mg Kα (1.253 keV) and O Kα (0.525 keV) |
SiO2 |
167 |
14 |
Si Kα and O Kα |
Si Kα (1.739 keV) and O Kα (0.525 keV) |
Si3N4 |
413 |
6 |
Si Kα and N Kα |
Si Kα (1.739 keV) and N Kα (0.392 keV) |
SiC |
13 |
3 |
Si Kα and C Kα |
Si Kα (1.739 keV) and C Kα (0.277 keV) |
As discussed above, ideally, if no correction of k-factors based on a thickness model is performed, then the elemental quantification needs to be carried out based on correct k-factors, corresponding to the specific TEM sample thickness. Those k-factors are abtained from known standards with the same sample thickness as that of the analyzing samples and those k-factors should be determined by measuring 4–5 TEM samples with the known element.
Figure 3774b shows the plot of the k-factor corrected Ga/In ratio of the K-lines, taken from a GaIn alloy, as a function of the probe radius (r) and TEM sample thickness (t).
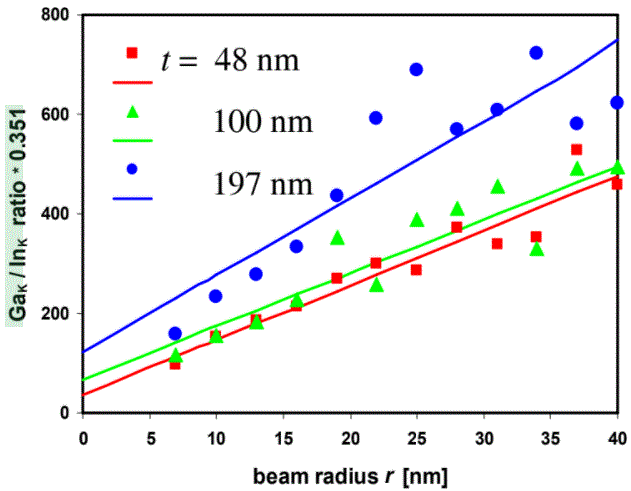
| Figure 3774b. Plot of the k-factor corrected Ga/In ratio of the K-lines as a function of the probe radius (r) and TEM sample thickness (t). [1] |
If the thin-film criterion is not satisfied, then a correction factor (CF) must be applied to the equations in page4624. For instance, the k factor should be modified and given by,
 ----------------------- [3774f] ----------------------- [3774f]
[1] T. Walther, A comparison of transmission electron microscopy methods to measure wetting layer thicknesses to sub-monolayer precision, Journal of Physics: Conference Series 126, 012091, (2008).
|