=================================================================================
Ideally, the number of charges n per incident photon with energy E (eV), generated in an EDS detector, can be given by
n = E/ε ------------------- [3775a]
Here, ε is equal to 3.86 eV for a Si EDS detector at 77 K and 2.96 eV for a Ge detector. For instance, if the detector receives one photon with an energy of 10 keV, ~2600 electrons (i.e. an extremely small charge of ~4 x 10-16 C) are then obtained from the detector.
The accuracy of EDS quantification is mainly limited by the counting statistics for the collection of X-rays not only in the determination of the kAB factors but also in the acquisition of the intensities IA,B. Therefore, the total percentage error in concentration is determined by the percentage errors of kAB and counts. In other words, the total error will be higher than the error in kAB alone or the error in counts alone.
In EDS measurements, the intensities of the X-ray peaks from various elements are determined by the factors below:
i) The path and energy of the incident high-energy electrons penetrating through the specimen.
ii) The ionization cross-sections of the elements.
iii) The X-ray yields.
iv) The collection probabilities of emitted X-rays (collected by the EDS detector).
All these factors above are constant for each particular characteristic X-ray if the thin film approximation is satisfied. Therefore, within this thin-specimen limit, the intensities of the peaks in EDS spectra increase with increase of specimen thickness, but the ratios of peak intensities remain unchanged if the elemental concentrations are constant. However, for thick specimens, the peak intensity ratios change due to a couple of reasons (e.g. X-ray absorption) and thus corrections are needed to obtain accurate quantifications.
Under certain electron-optical operating conditions, the detected intensity (I) of a specific X-ray line is given by,
Idetected = κ · Ω ----------------------- [3775b]
where,
κ -- A term that depends on all the physics factors involving x-ray generation, absorption and fluorescence processes in the specimen,
Ω --
The solid angle of the EDS detector.
Therefore, the intensities of the X-ray peaks are not only affected by the specimen but also by the detector characteristics.
The absolute X-ray intensity is a function of both the thickness and composition of the specimen. However, the ratio of the recorded X-ray intensities IA/IB for two elements A and B is independent of thickness. If the EDS detector is not windowless, it is necessary to include the efficiency of EDS detector to theoretically evaluate the intensity ratio between two or more elements. In this case, the intensity ratio obtained by the detector is given by,
 ------------------------------- [3775c] ------------------------------- [3775c]
Where,
IEA and IEB -- The intensities of elements A and B actually emitted from the EM specimen,
εEA and εEB -- The detection coefficient of the two elements.
By combining Equations 3775c and 4646a (note that IEA here is IAon page 4646), we can obtain that the ratio received by the detector can be given by,
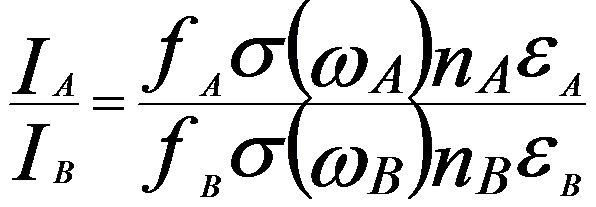 ------------------------------- [3775d] ------------------------------- [3775d]
Equation 3775d indicates that the ratio is not dependent on the effective probe diameter, the EM film thickness, or the current in the electron probe, even though the absolute intensities are related to those factors.
As an example, Figure 3775 shows the EDS spectrum taken from crystal SiC nanowires. Notice that even though SiC is in equiatomic stoichiometry, the intensity of the C (carbon) peak in the spectrum is much less than that of the Si (silicon) peak.
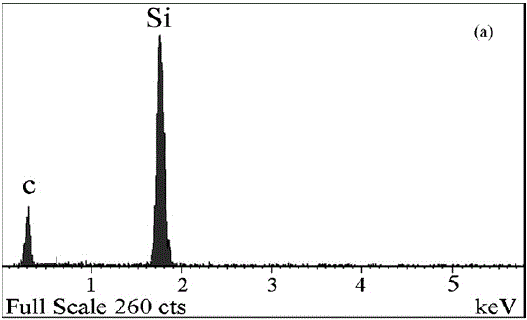
Figure 3775. EDS spectrum taken from crystal SiC nanowires.
Adapted from [1]
Furthermore, the main advantage of using a thin specimen for x-ray microanalysis are:
i) The improved spatial resolution over that obtainable in a bulk specimen,
ii) X-ray absorption and secondary fluorescence are minimal,
iii) The measured intensity is, to a first approximation, the same as the generated intensity.
In principle, the counting statistics of X-ray spectra limits the accuracy of quantification. If the peaks are strong comparing with a weak background, the standard deviation, σ, can be given by,
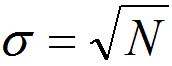 ----------------------------------- [3775e] ----------------------------------- [3775e]
where,
N -- The number of X-ray counts in the peak after background subtraction.
For EDS and EELS techniques in EMs, if a series of measurements are repeatedly performed on a specimen, then the distribution of counts would often follow a Poisson distribution. If the number of the measurements is large, the distribution can be approximately given by a Gaussian distribution. In this case, the standard deviation of 3σ, when it has 99% confidence limit in the X-ray peak intensity, is usually used to estimate the error,
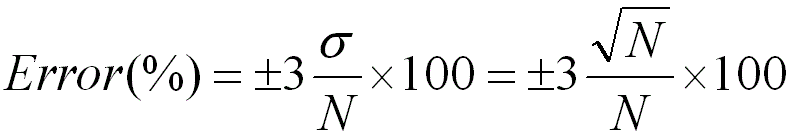 ----------------------------- [3775f] ----------------------------- [3775f]
Therefore, in general, the greater N is, the lower the error in the EDS analysis is.
Table 2513 lists some examples of necessary measurement counts to satisfy the needed accuracies and confidence levels. In general, the maximum useful count rate for an EDS system is approximately 2000-3000 counts/s for the total counts collected over the entire spectrum.
Table 2513. Necessary measurement counts to satisfy the needed accuracies and confidence levels.
Accuracy |
Confidence level |
Necessary counts |
1% |
99% |
105 |
1% |
68% |
104 |
According to Equation 3775f, for a binary system with elements A and B, the error in IA/IB is given by,
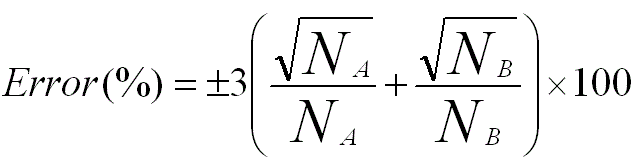 ----------------------------- [3775g] ----------------------------- [3775g]
On the other hand, the error in IA/IB can obviously be decreased if several EDS recordings are taken. For instance, the absolute error at the 95% confidence level in n recordings of IA/IB is given by,
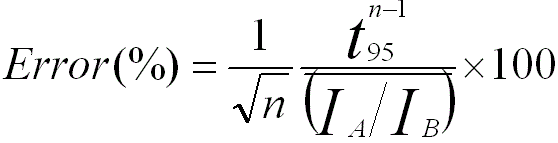 ----------------------------- [3775h] ----------------------------- [3775h]
where,
 -- The Student t value. -- The Student t value.
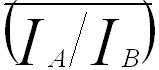 -- The average value of IA/IB. -- The average value of IA/IB.
It is necessary to highlight that except for the random errors from counting statistics discussed above, some factors, however, will contribute systematic errors. Those factors are mainly:
i) The accuracy of the chemical composition of the standard (if calibration or correction of kAB factors is applied).
ii) The presence of spurious X-rays.
iii) The inaccuracy of evaluation of the specimen thickness.
iv) The deconvolution of overlapping peaks.
v) Thee background-fitting routine.
The count of X-ray acquisition can be increased mainly by:
i) Increase of acquisition time. The acquisition time may be increased if we have good stability of specimen stage and drift-correction software is used.
ii) Increase of solid angle of EDS detector.
iii) Thicker TEM specimens or SEM specimens are used. However, there are some drawbacks if such specimens are used.
[1] X.W. Du, X. Zhao, S.L. Jia, Y.W. Lu, J.J. Li, N.Q. Zhao, Direct synthesis of SiC nanowires by multiple reaction VS growth, Materials Science and Engineering B 136 (2007) 72–77.
|