Chapter/Index: Introduction | A | B | C | D | E | F | G | H | I | J | K | L | M | N | O | P | Q | R | S | T | U | V | W | X | Y | Z | Appendix
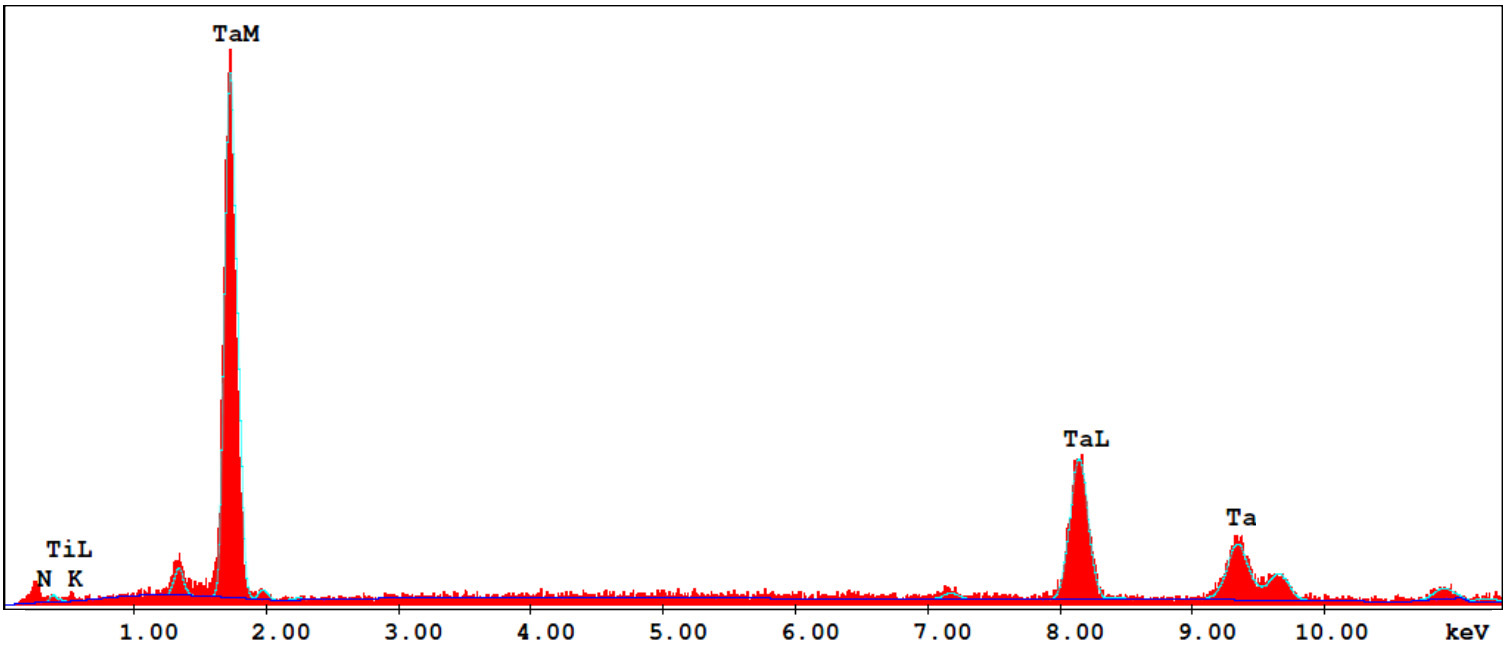
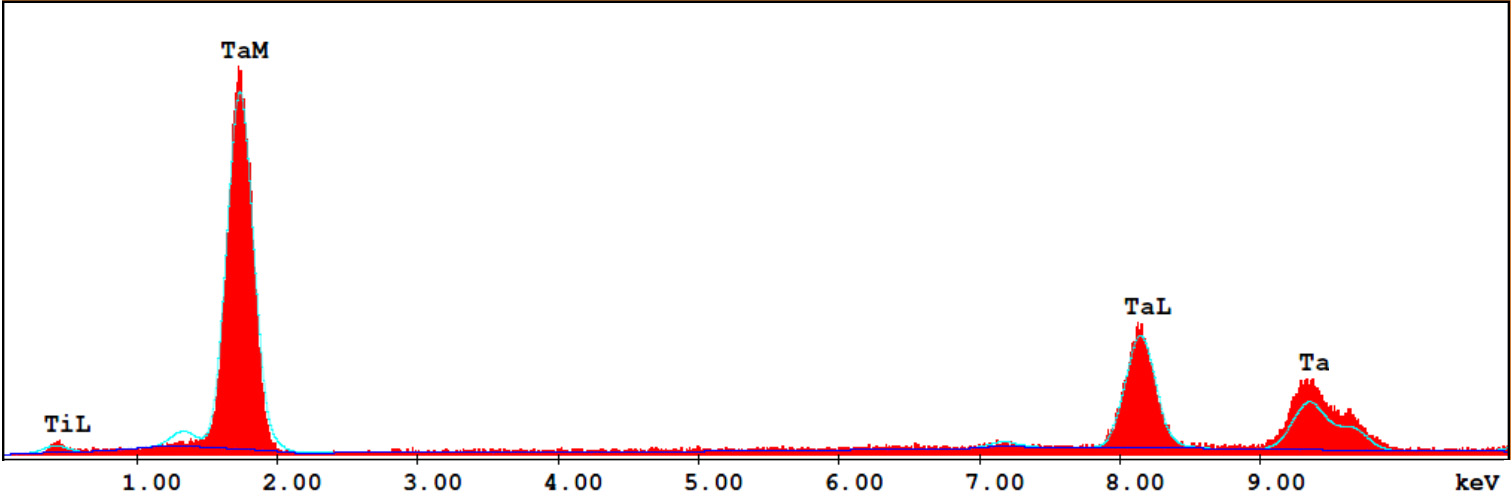
| Figures 1257a and 1257b show EDS spectra of 5 μm and 12 μm thick Ta films deposited on Si substrates with nitrogen flow rates of 5% and 0%, respectively. The spectra were taken in a same SEM system. No Si signal was detected so that the interaction volume is shallower than the Ta thicknesses. We can see that the ratios of M and L peak heights in the two figures are different most likely due to the Ti impurity in the Ta films.
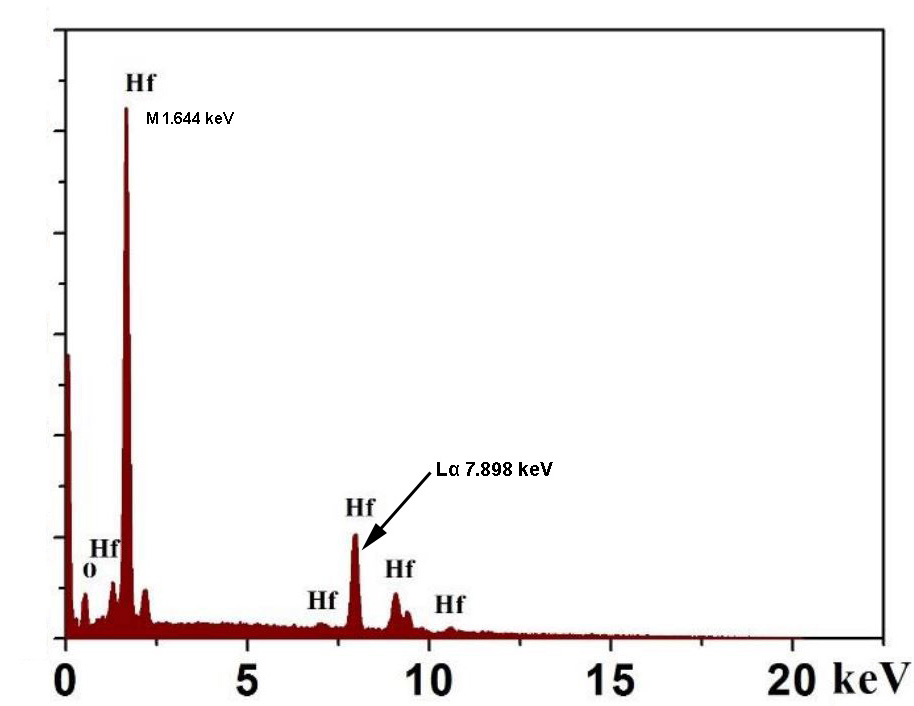
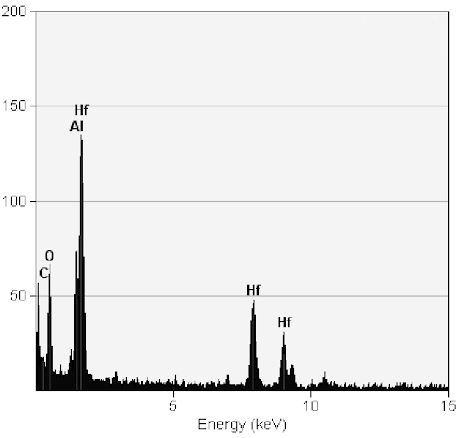
Figures 1257c and 1257d were taken in two different TEM systems. The ratios of M and Lα peak heights are different in the two figures due to various reasons such as differences of detectors and sample thicknesses.
Figure 1257c. EDS spectrum of HfO2. The ratio of M and Lα peak heights is 1:0.202.
[1] www.oregonstate.edu.
|