Rocking-curve Intensity Oscillations within CBED
- Practical Electron Microscopy and Database -
- An Online Book -

https://www.globalsino.com/EM/  


This book (Practical Electron Microscopy and Database) is a reference for TEM and SEM students, operators, engineers, technicians, managers, and researchers.
 

=================================================================================

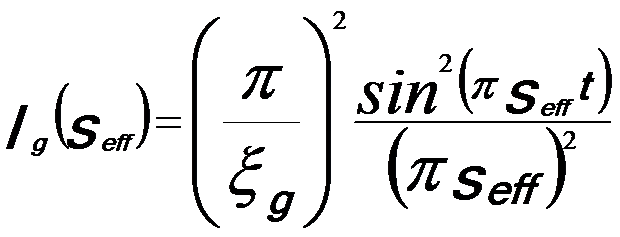
The variation in s causes intensity oscillation across the disk. For instance, the intensity of a diffracted beam, Ig(s), is the function of an effective deviation parameter, seff:

          intensity of a diffracted beam ---------------------------- [1990a]

where ξg is the extinction distance for the diffraction g. seff is given by,
          intensity of a diffracted beam ---------------------------- [1990b]

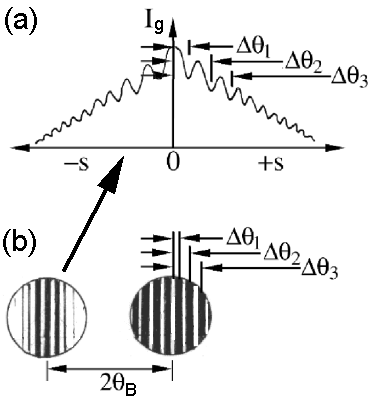
Figure 1990 shows the calculated intensity profile of Ig as a function of s and 2θB (the separation of the (000)- and (hkl)-disks). The profile in Figure 1990 (a) is also called rocking curve.

The separation (2θB) of the (000)- and (hkl)-discs under two-beam conditions

Figure 1990. (a) The calculated intensity profile of Ig as a function of s (equals to an intensity trace taken across the g disk), and (b) The separation (2θB) of the (000)- and (hkl)-discs under two-beam conditions


=================================================================================

The book author (Yougui Liao) welcomes your comments, suggestions, and corrections, please click here for submission. You can click How to Cite This Book to cite this book. If you let Yougui Liao know once you have cited this book, the brief information of your publication will appear on the “Times Cited” page.


Copyright (C) 2006 GlobalSino, All Rights Reserved