Chapter/Index: Introduction | A | B | C | D | E | F | G | H | I | J | K | L | M | N | O | P | Q | R | S | T | U | V | W | X | Y | Z | Appendix
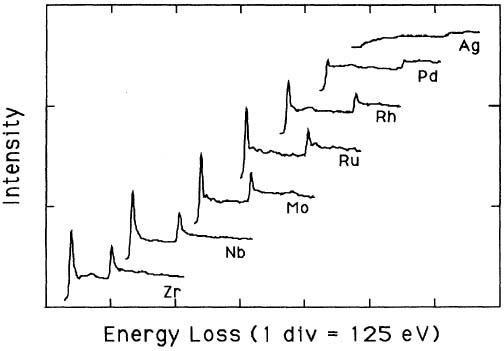
| Pearson et al. [1] experimentally and theoretically (based on one-electron Hartree-Slater calculations) found that the intensities of L2,3 white lines for most of the 3d and 4d transition metals decreased nearly linearly with increasing atomic number, reflecting the filling of the d states. Figure 3422a shows the deconvoluted and background-subtracted L2,3 energy-loss spectra for the 4d transition metals. The edge energies are not shown in order to present all the spectra on the same figure, while the intensities of the white lines are scaled simultaneously for all elements.
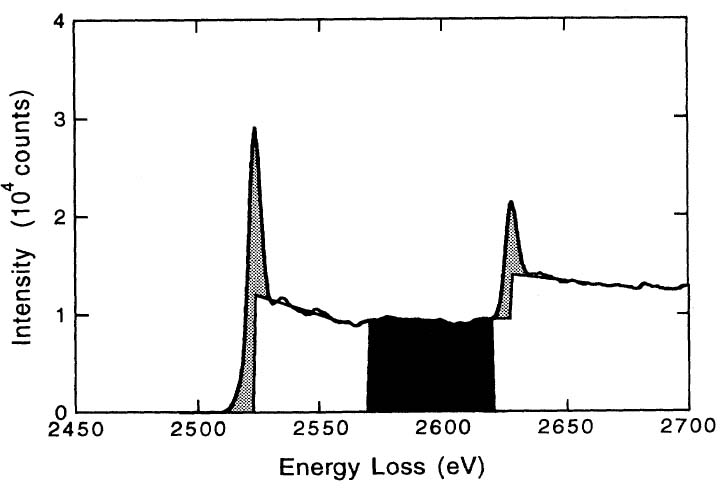
Figure 3422a. The deconvoluted and background-subtracted L2,3 energy-loss spectra for the 4d transition metals. [1] In order to quantify the correlation between the intensities of the white lines and the d holes (or occupancy), the intensities of the white lines are normally obtained by subtracting the background from the signal. Figure 3422b illustrates the method for isolating and normalizing the white lines for 4d transition Mo (molybdenum) metal. The background intensity is modeled by step functions in the threshold regions. A straight line over a range of ~ 50 eV is fit to the background intensity immediately following each white line. The normalized L2,3 white-line intensity is defined as the integrated intensity of the L2 and L3 white lines divided by the integrated intensity in the normalization window 50 eV in width beginning 50 eV past the L3 edge onset. A linear correlation of the normalized white line intensity, I4d, with 4d occupancy, n4d (n4d = 5 for Mo, see Tables in page4696), is obtained with a fit given by,[1] where, the constant, K, is arbitrary and depends on the specific normalization scheme.
Figure 3422b. Schematic illustration of L2,3 edges of Mo transition metal By fitting the constants, the normalized white-line intensities for steps at peaks (Equation 3422b) and at onsets (Equation 3422c) can be given by, [1]
[1] D. H. Pearson, C. C. Ahn, and B.Fultz, White lines and d-electron occupancies for the 3d and 4d transition metals, Physical Review B, 47(14), (1993) 8471-8478.
|