Chapter/Index: Introduction | A | B | C | D | E | F | G | H | I | J | K | L | M | N | O | P | Q | R | S | T | U | V | W | X | Y | Z | Appendix
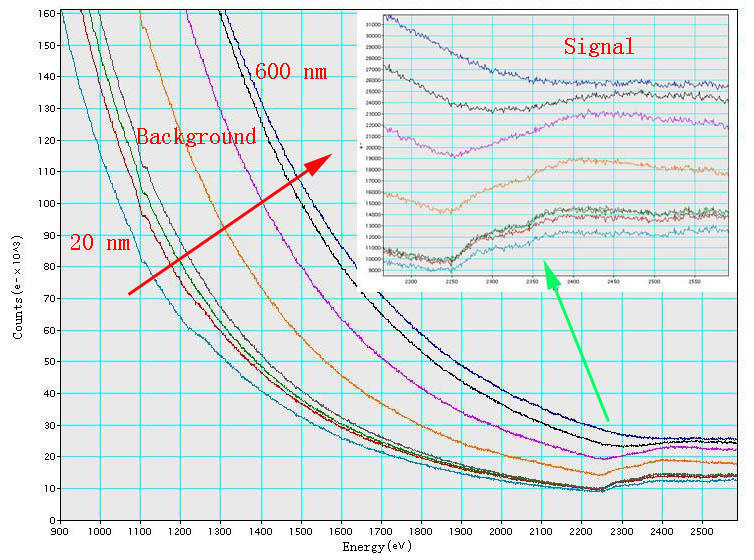
| An EEL spectrum always has a background in addition to low- and high-energy losses. On the other hand, multiple-scattering events remove EELS intensity from the zero- and lower-loss regions of a spectrum into higher-loss region, and thus increases the background for higher-energy losses. Furthermore, the background intensity increases more rapidly than peak intensities. The background due to zero and other energy loss may vary across the specimen due to local changes in composition and thickness. For instance, Figure 4720a shows that the background increases dramatically with increase of the thickness of TEM specimen, while the signal of Pt M4,5 edge decreases significantly. The highest signal in the range of these TEM specimen thicknesses for Pt occurs at 20 nm.
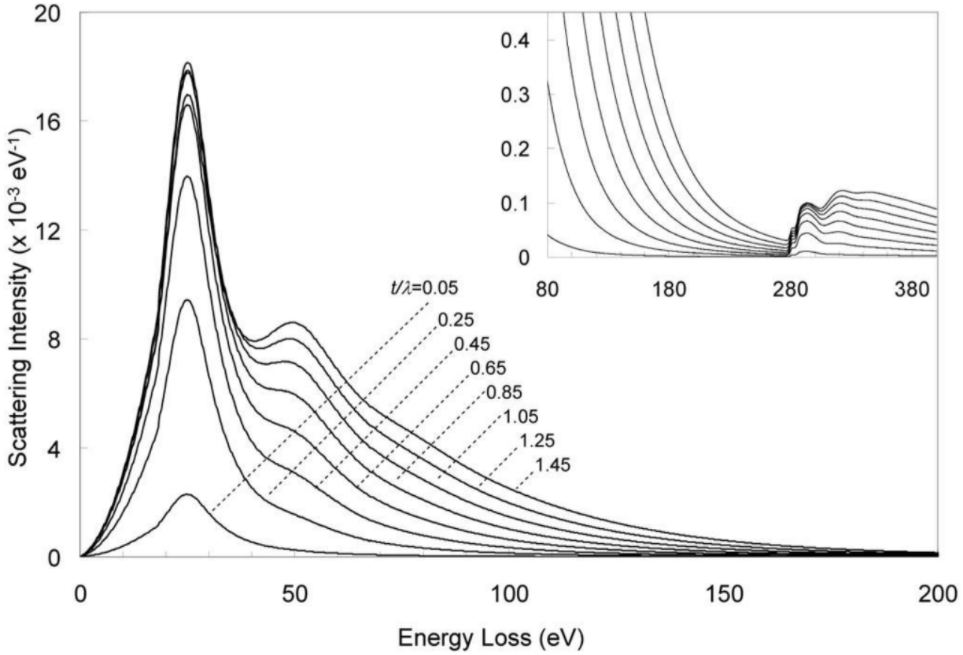
Figure 4720a. EELS of Pt M4,5 edge. Figure 4720b shows carbon (C) EELS for t/λ varying from 0.05 to 1.45, calculated from the single scattering distribution based on Poisson Distribution. It clearly shows that the background increases nonlinearly as a function of t/λ corresponding to the multiple scattering terms. On the other hand, as t/λ increases, the shape of the spectrum changes due to the multiple scattering.
[1] M. A. Aronova, Y. C. Kim, G. Zhang, and R. D. Leapman, Quantification and Thickness Correction of EFTEM Phosphorus Maps, Ultramicroscopy. 2007 ; 107(2-3): 232–244.
|