Chapter/Index: Introduction | A | B | C | D | E | F | G | H | I | J | K | L | M | N | O | P | Q | R | S | T | U | V | W | X | Y | Z | Appendix
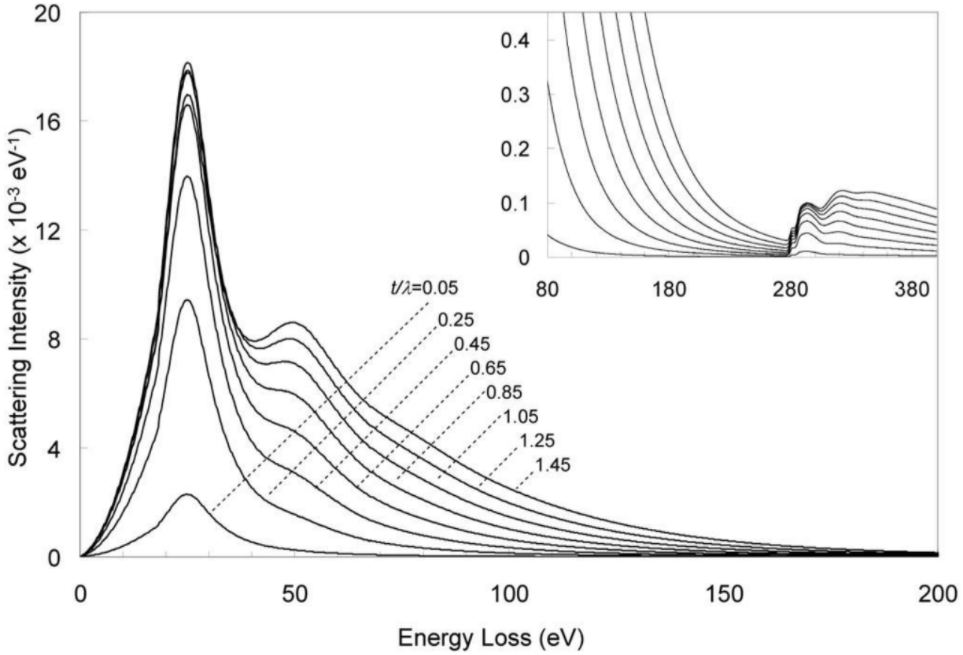
| It is well known that the shape of energy-loss spectra changes with specimen thickness due to plural inelastic scattering. Figure 957 shows carbon (C) EELS for t/λ varying from 0.05 to 1.45, calculated from the single scattering distribution based on Poisson Distribution. It clearly shows that the background increases nonlinearly as a function of t/λ corresponding to the multiple scattering terms. On the other hand, as t/λ increases, the shape of the spectrum changes due to the multiple scattering.
[1] M. A. Aronova, Y. C. Kim, G. Zhang, and R. D. Leapman, Quantification and Thickness Correction of EFTEM Phosphorus Maps, Ultramicroscopy. 2007 ; 107(2-3): 232–244.
|