Chapter/Index: Introduction | A | B | C | D | E | F | G | H | I | J | K | L | M | N | O | P | Q | R | S | T | U | V | W | X | Y | Z | Appendix
| Up to now, there is no physical theory to predict the EELS background accurately. In general, the EELS background originates from: The background intensity is often comparable to, or greater than, the core-loss signal of interest. [1] Therefore, it is important to minimize the background contribution by using thin specimens in order to reduce the plural scattering contribution to the recorded electron energy-loss spectrum. Therefore, due to the complex contributions of different interaction phenomena, it is not possible to calculate the real background ab initio. However, in energy regions away from the low loss (iii mentioned above) and sufficiently beyond any preceding ionization edge (iv mentioned above), the background intensity IB can generally be modelled by a power-law fit.
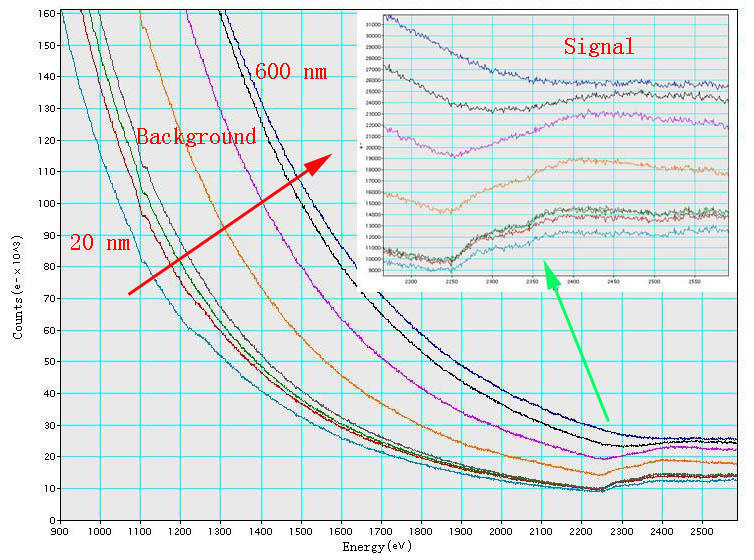
Figure 4724a. Schematic illustration of EELS “effective” interaction volume. These characteristic ionization edges in EELS are superimposed on a background due to zero and other energy losses. The separation of energy loss signal from the background is necessary for extracting elemental information for elemental quantification and mapping. Due to the complexity of process contributing to the background, it is not possible to model the background from first principles. The method usually performed to calculate the background is to estimate the background contribution under the edge from the pre-edge area. The background in EELS also varies with specimen thickness. For instance, Figure 4724b shows that the background increases dramatically with increase of the thickness of TEM specimen, while the signal of Pt M4,5 edge decreases significantly. The highest signal in the range of these TEM specimen thicknesses for Pt occurs at 20 nm.
Figure 4724b. EELS of Pt M4,5 edge. Table 4724. Background models.
[1] P.J. Thomas and P.A. Midgley, An introduction to energy-filtered transmission electron microscopy, Topics in Catalysis, 21 (4), (2002), 109.
|