Chapter/Index: Introduction | A | B | C | D | E | F | G | H | I | J | K | L | M | N | O | P | Q | R | S | T | U | V | W | X | Y | Z | Appendix
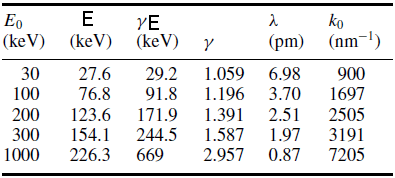
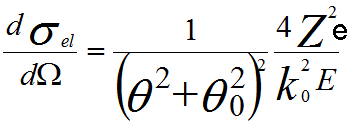
| Because the nuclear mass is much more than the rest mass of an electron (e.g. the electron has 1823 times less mass than a proton), the energy exchange is small and usually unmeasurable during the interaction of an incident electron with an atomic nucleus, acting as a physical process of elastic scattering. Various relatively simple models of elastic scattering are available in the literature. For instance, a free-atom Thomas–Fermi model with partial wave expansion [1] or Mott cross-sections for a screened Coulomb potential [2] have been suggested. For elastic scattering by a single atom the simple atomic Lenz mode of the differential cross section that represents the probability of scattering per unit solid angle Ω is given by [3] or, Here θ is the scattering angle of the electron, θ0 the angular width of the scattering distribution, k0 is the electron wavenumber (2π/wavelength), E the ‘nonrelativistic’ incident energy , Z the atomic number, and e the elementary charge. The angular width of the scattering distribution, sometimes called characteristic screening angle, (θ0) is given by, where r0 = a0Z -1/3 is the screening radius of atomic electrons, and a0 is the first Bohr radius (53 × 10−12 m). It is necessary to mention that θ0 ≈ 100 θE, where θE denotes the characteristic angular range of inelastically scattered electrons as given by, θE=E/γm0v2 ----------------------------------------------------------------------------------------------------- [4774d] where γ is the usual relativistic factor. The ‘nonrelativistic’ incident energy (E) is given by where m0c2 = 511 keV is the electron rest energy. E is less than the actual kinetic energy E0 because the relativistic mass of the electron exceeds its rest mass m0 as shown in Table 4774a.
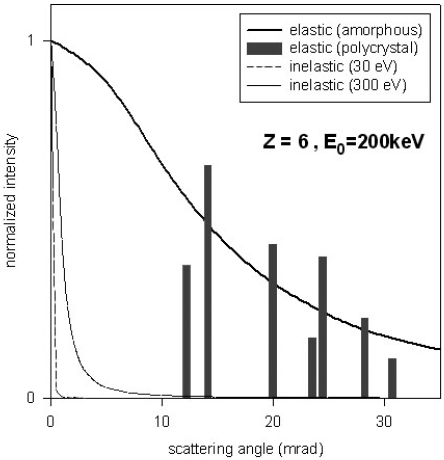
Figure 4774 gives the curves showing the angular distribution of elastic and inelastic scattering, calculated for 200 keV electrons in amorphous carbon. The angular distribution of elastic scattering (θ0) is quite narrow for the incident-electron energies used in a TEM (about 20 mrad or 0.35° for incident electrons at 100 keV). To be scattered through a large angle (θ >> θ0), the electrons must pass very close to the nucleus.
The above theory is good for amorphous materials. Even though crystalline structures scatter electrons over a similar angular range, the scattering is confined to Bragg angles as seen in Figure 4774. The elastic scattering is then called diffraction. The reason of why we have a width for the discrete diffraction spots (black rods) instead of sizeless point is due to electron-phonon scattering. The first peak in EELS spectrum occurs at 0 eV, called the zero-loss peak. This is the most intense peak, especially for a very thin specimen. It represents electrons that did not undergo inelastic scattering but which might have been scattered elastically through interaction with atomic nuclei. The electrons recorded in the zero-loss peak may still have a very small energy loss, which is not measurable. Table 4774b shows that electrons interact with 1 electron, many electrons, 1 nucleus, and many nuclei in solids. Table 4774b. Effects of interactions of electrons in solids.
[1] Ichimura, S., Aratama, M., Shimizu, R., 1980. Monte Carlo calculation
approach to quantitative Auger electron spectroscopy. J. Appl. Phys.
51, 2853–2860.
|
||||||||||||||||||||||||||
 ------------------------------------------------- [4774a]