Chapter/Index: Introduction | A | B | C | D | E | F | G | H | I | J | K | L | M | N | O | P | Q | R | S | T | U | V | W | X | Y | Z | Appendix
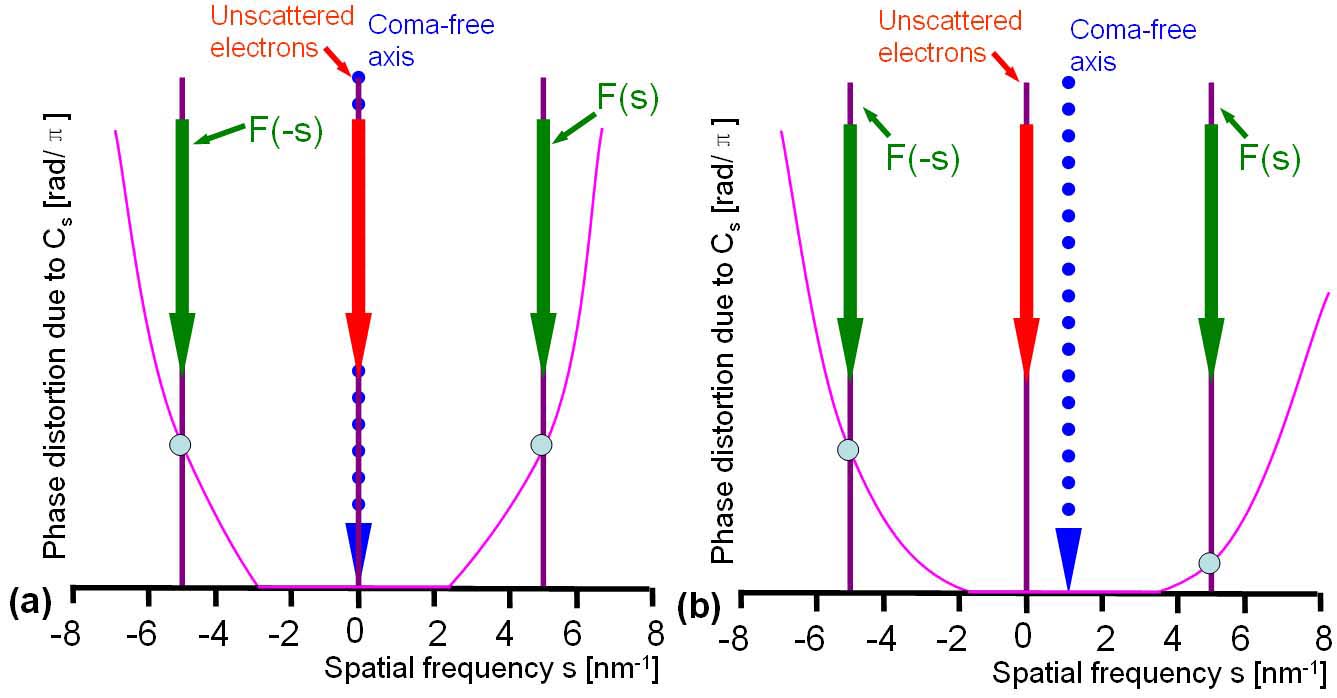
| Axial coma is an image aberration that is introduced when the illumination is not parallel to the optical axis of the objective lens and is found mostly at high magnifications and high resolutions in TEM observations. The effect of coma aberration was initially demonstrated by Zemlin using a diffractogram tableau method that is a set of the diffractograms obtained by rotating the azimuth of the beam tilt direction [2]. Unlike the effects of defocus and spherical aberration, the effect of coma generally cannot be represented in terms of contrast transfer function. A specific tilt angle of the electron beam can be found such that the image coma becomes negligible for a chosen point in the TEM specimen. In this case, the position of the unscattered (transmitted) electron beam, focused in the back focal plane of the objective lens, lies on the optical axis. More accurately speaking, one refers to this axis as the coma-free axis for the given point in the specimen, but one normally refers to the axis defined by coma-free alignment as being optical axis. In the coma-free aligned case, where the unscattered electrons are along the coma-free axis as shown in Figure 4326a (a), the phase-distortion function (or called phase shift) has the same value on the opposite sides of the scattered (diffracted) waves when the incident illumination is tilted relative to the optical axis of the objective lens. In Figure 4326a (b), the origin of the phase distortion function is shifted relative to the origin of the structure factor when the illumination is tilted, and thus the respective phase shifts at spatial frequencies s and -s are no longer the same for the pair of interference fringes that is generated by Friedel mates F(s) and F(-s).
Figure 4326a. Phase-distortion functions in coma-free aligned (a) and unaligned (b) cases. The spatial resolution is reduced in one direction if axial coma exists. If the intensity distribution in the pattern is not symmetric, a coma component in the defocus is probably present. In coma case, most of its intensity distributes on one side and a “comet tail” on the other as shown in Figure 4326b.
Figure 4326b. Axial coma. Adapted from [1] Table 4326 gives the aberration coefficient nomenclature. The coma aberrations are marked in blue. Table 4326. Aberration Coefficient Nomenclature. The aberration coefficients have two
It is interesting to mention that ideally the aplanatic lenses, which can in some cases be condenser or objective lenses, are free of spherical aberration and off-axial coma simultaneously.
[1] Joachim Zach and Maximilian Haider, Aberration correction in a low voltage SEM by a multipole corrector, Nuclear Instruments and Methods in Physics Research A 363 (19953 316-325.
|
||||||||||||||||||||||||||||||||||||||||||||||||||||||||||||||||||||||||||||||||||||||||||||||||||||||||