Chapter/Index: Introduction | A | B | C | D | E | F | G | H | I | J | K | L | M | N | O | P | Q | R | S | T | U | V | W | X | Y | Z | Appendix
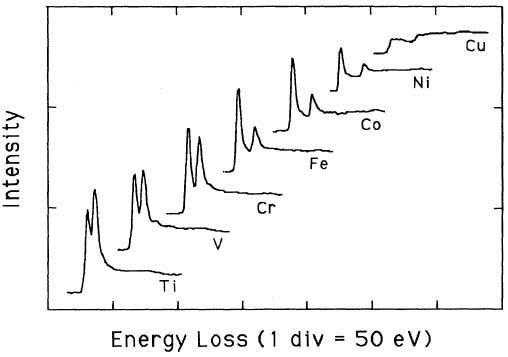
| Pearson et al. [1] experimentally and theoretically (based on one-electron Hartree-Slater calculations) found that the intensities of L2,3 white lines for most of the 3d and 4d transition metals decreased nearly linearly with increasing atomic number, reflecting the filling of the d states. Figure 4770a shows the deconvoluted and background-subtracted L2,3 energy-loss spectra for the 3d transition metals. The edge energies are not shown in order to present all the spectra in the same figure, while the intensities of the white lines are scaled simultaneously for all elements.
Figure 4770a. The deconvoluted and background-subtracted L2,3 energy-loss spectra for the 3d transition metals. [1] The L2,3 ELNES of Fe (Fe2+ and Fe3+) shows multiplet structures of valences representing valence fingerprints. More than one valency and coordination of Fe is often present in the same material, e.g. mineral. Minerals containing Fe2+ and Fe3+ are most commonly octahedrally coordinated, although Fe in tetrahedral coordination is sometimes found. The splitting of the L3 edge gives the signature of multiple valence states in mixed valence Fe-bearing minerals. Figure 4770b shows energy-loss spectrum of an iron fluoride film, taken with TEM-EELS system.
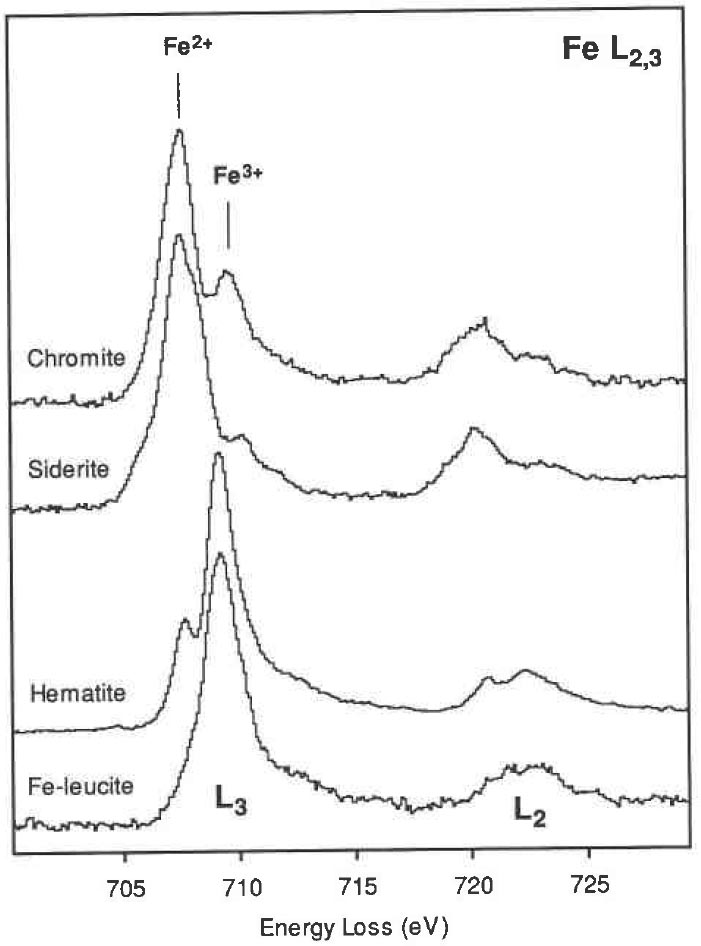
Figure 4770b. Energy-loss spectrum of an iron fluoride (FeF2) film: (a) low-loss region with a logarithmic intensity scale and Peaks: Low-loss, including zero loss (first peak), which is the most intense In Figure 4770c, the Fe L2,3 edges from leucite (Fe3+), hematite (Fe3+), siderite (Fe2+), and chromite (Fe2+) show different edge shapes. [3]
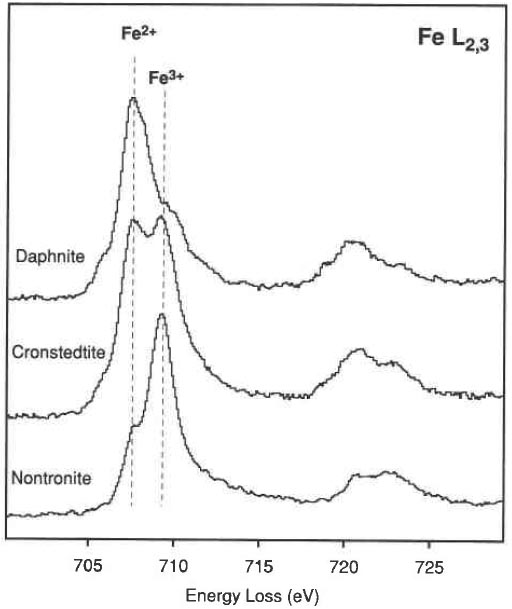
Figure 4770c. The Fe L2,3 edges from leucite (Fe3+), hematite (Fe3+), siderite (Fe2+), and chromite (Fe2+). [3] Figure 4770d shows Fe L2,3 edges from three phyllosilicates: nontronite (dominantly Fe3+), cronstedtite (Fe2+ and Fe3+) and the chlorite daphnite (dominantly Fe2+ with a few percent Fe3+).
Figure 4770d. Fe L2,3 edges from three phyllosilicates. [3] Table 4770a shows the energies (eV) of the Fe L3 and L2 edge peak maximum of some materials and the separation of the L3 and L2 peak maxima because of spin orbit splitting. Table 4770a. The energies (eV) of the Fe L3 and L2 edge peak maximum of
some materials and the
Figure 4770e shows EEL spectrum for pure iron (Fe) showing the isolated white line intensities and the normalization energy window 50 eV width. This signal isolation presents a method to remove the background of the measured spectrum.
Figure 4770e. EEL spectrum for pure iron (Fe) showing the isolated white
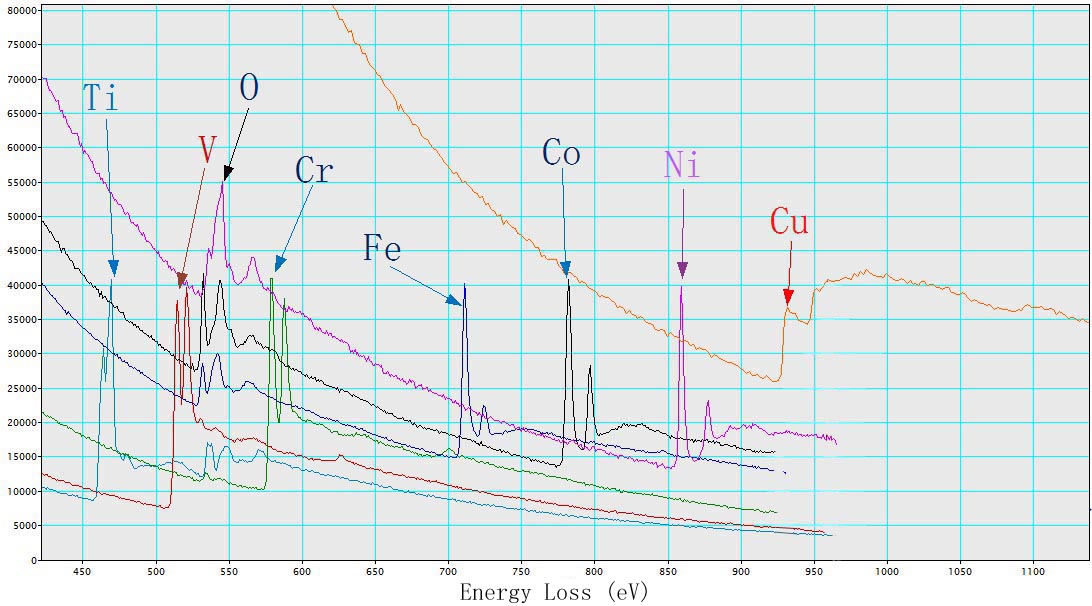
line intensities and the normalization energy window 50 eV width. [4] Figure 4770f shows EEL spectra of TiO2, V, Cr, Fe2O3, CoO, NiO, and Cu with L2,3 energy-losses for the 3d transition metals. The chemical shift of O element in the different oxides (TiO2, Fe2O3, CoO, and NiO) is also indicated in the figure. The main edges of Ti, V, Cr, Fe, Co, Ni and Cu, and their edge onsets are listed in Table 4770b.
Table 4770b. Main edges of Ti, V, Cr, Fe, Co, Ni, and Cu, and their edge onsets.
[1] D. H. Pearson, C. C. Ahn, and B.Fultz, White lines and d-electron occupancies for the 3d and 4d transition metals, Physical Review B, 47(14), (1993) 8471-8478.
|