| The intensity of Electron Energy Loss Spectroscopy (EELS) in a Transmission Electron Microscopy (TEM) sample is affected by the mass and thickness of the sample due to several factors related to how electrons interact with the material:
- Electron Scattering
- Mass and Atomic Number: Heavier atoms (with higher atomic numbers) in the sample tend to scatter electrons more strongly than lighter atoms. This scattering can cause a decrease in the intensity of the electron beam passing through the sample. As the atomic mass increases, the probability of inelastic scattering (where energy loss occurs) also increases, affecting the EELS signal.
Figure 1385a shows the effect of atomic mass on scattering probability and EELS intensity.

Figure 1385a. Effect of atomic mass on scattering probability and EELS intensity. |
-
Thickness: The thicker the sample, the more material the electrons must pass through, leading to increased scattering events. As the electrons lose energy through these interactions, the intensity of the EELS signal can be diminished. A thicker sample will cause more electrons to undergo multiple scattering events, complicating the interpretation of the EELS spectrum. Figure 1385b shows the effect of sample thickness on EELS intensity and scattering.
As the sample thickness increases, the scattering intensity gradully rises due to the greater number of atomic interactions the electrons experience as they pass through the material. Initially, at smaller thicknesses, both the EELS intensity and the multiple scattering effect increase because the electrons are interacting more with the atoms, leading to more inelastic scattering events that contribute to the EELS signal.
However, as the thickness continues to increase, the probability of electrons undergoing multiple scattering events increases, which starts to complicate the EELS spectrum. This leads to a reduction in the EELS intensity due to the more energy losses and scattering events. The multiple scattering effect, after reaching a peak at a certain thickness, begins to decrease as the excessive scattering events cause electrons to deviate significantly from their original path, leading to a loss of coherence in the detected signal. This behavior highlights the importance of optimizing sample thickness in EELS measurements to balance between obtaining a strong signal and minimizing the effects of multiple scattering.

Figure 1385b. Effect of sample thickness on EELS intensity and scattering. |
- Inelastic Scattering Probability
- Sample Thickness: As the thickness of the TEM sample increases, the probability of inelastic scattering events (which are detected in EELS) increases. However, after a certain thickness, the number of inelastic scattering events can become too high, leading to multiple scattering effects that can complicate or dilute the EELS signal. This results in a reduced overall intensity as some electrons are scattered out of the detection range. Figure 1385c shows the relationship between inelastic scattering probability and sample thickness.

Figure 1385c. Relationship between inelastic scattering probability and sample thickness. |
-
Mass Density: A higher mass density means that the sample has more atoms per unit volume, which increases the likelihood of inelastic scattering events. This also means that, for a given thickness, a sample with a higher mass density will produce a stronger EELS signal than one with a lower mass density.
- Multiple Scattering
- Mass: Heavier atoms cause more multiple scattering events, which can spread the energy loss over a broader range, reducing the peak intensity in specific energy loss features of interest.
- Thickness: As the sample thickness increases, electrons are more likely to undergo multiple scattering events. These events can complicate the EELS spectrum by creating additional energy loss peaks or broadening existing peaks, thereby reducing the clarity and intensity of specific features.
Fig ure 1385g shows two correlation plots calculated from filtered image series taken with a 25 eV slit at conditions in three window method: pre-edge 1 = 225 eV, pre-edge 2 = 265 eV and with post-edge = 295 eV and with energy window = 315 – 295 = 20 eV, respectively. The optimal specimen thickness around t/λ = 0.4 for carbon under the condition of 200 keV (energy of the incident electron beam) and 7.6 mrad (collection angle). Extremely thin specimen areas cause the SNR ( Signal-to-Noise Ratio) to drop due to increased noise, whereas plural scattering in thick areas decreases the signal relative to the background (similar to the case described in Figure 1385h). A shift of the post-edge window by 20 eV (Figure 1385g (b)) lowers the maximum SNR value of approximately 25% as a fact of a larger background extrapolation error (h) and a decreased signal.
| Figure 1385g. Correlation plots showing the influence of thickness and of changes in post-edge window position on the signal to noise ratio [1]. |
The major drawbacks and difficulty in quantitative and even qualitative EELS analysis is the strong effect of the sample
thickness on the detection of EELS edges. For instance, the spectrum from "thick" TEM sample might show no edges. Figure 1385h shows that the background increases dramatically with increase of the thickness of TEM specimen, while the signal of Pt M4,5 edge decreases significantly. The highest signal in the range of these TEM specimen thicknesses for Pt occurs at 20 nm.
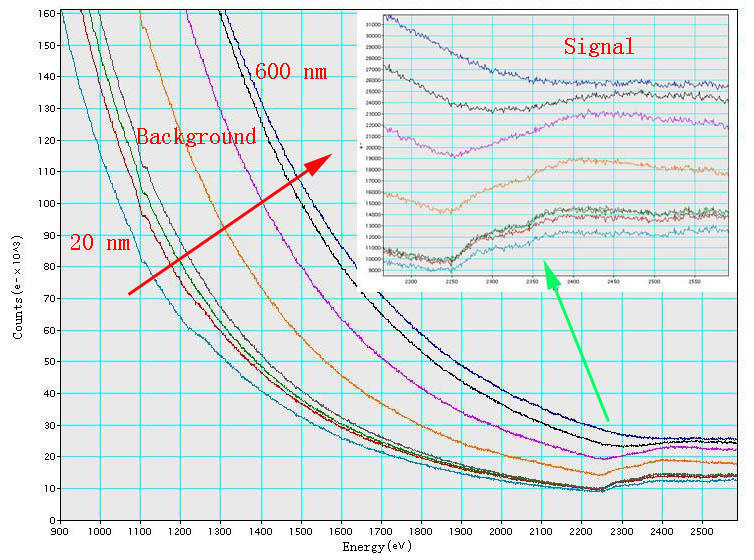
Figure 1385h. EELS of Pt M4,5 edge.
Furthermore, as presented by Hawkes and Spence [2], this
severe limitation to the visibility of edges is due to the contribution of
multiple inelastic scattering that increases the background under the
edge. On the other hand, the contribution of multiple scattering is not constant as a function of energy loss and the quantification of spectra for increasingly thick samples demonstrates a variation of the apparent concentration with thickness. Measurements of the ratio of two elements, for instance, show that samples with thickness relative to the mean inelastic free path t/λ > 0.5 are unreliable
(Figure 1385i). Even when multiple scattering effects are removed with deconvolution techniques, the effects still persist [3], indicating that additional contributions due to the angular distributions of losses are present and cannot be neglected in correction approaches.
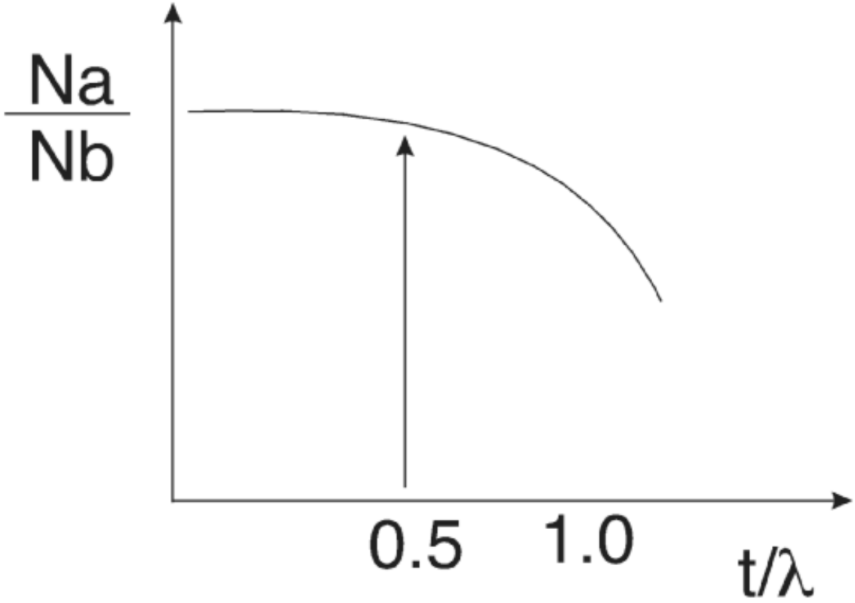
| Figure 1385i. Variation in the
quantification of two elements
as a function of thickness
relative to the total inelastic
mean free path. [2] |
It also shows, see page3819, that there is an angular dependence of thickness effect on visibility of EELS singal.
Figure 1385j shows the mass-thickness effects on both EDS and EELS signals (or intensities). Both signals increases with the mass-thickness factor (f) when the factor f is smaller than fms1, while the the EELS signal decreases rapidly when f is greater than fms1. On the other hand, the EELS signal becomes smaller than EDS signal when f is greater than fms2. Therefore, the EDS and EELS signals will be reversed between the cases of f < fms1 and f >fms2. That is, in the case of f >fms2, higher concentration of an specific element probably does not provide high intensity or contrast in EELS measurements, but it does for EDS.
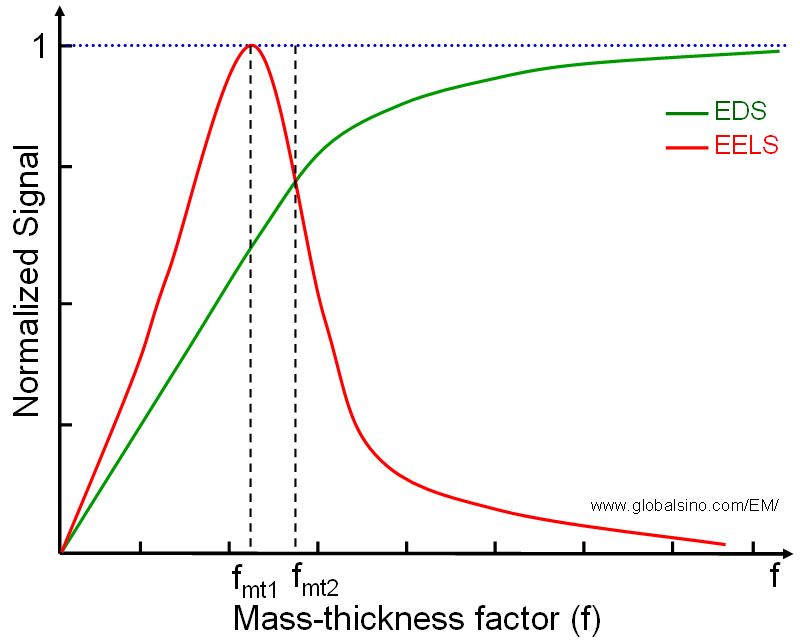
| Figure 1385j. Mass-thickness effects on both EDS and EELS signals (or intensities). |
[1] Optimization of the signal to noise ratio in EFTEM elemental maps with regard to different eonization edge types, Kothleitner, G and Hofer, F, Micron, 29, 5, pp. 349–357, (1998).
[2] Peter W. Hawkes and John C.H. Spence, Science of Microscopy, Volume I, (2007).
[3] Egerton, R. (Ed.) (1996). Electron Energy-Loss Spectroscopy in the Electron Microscope, 2nd ed. (Plenum, New York).
|
