Chapter/Index: Introduction | A | B | C | D | E | F | G | H | I | J | K | L | M | N | O | P | Q | R | S | T | U | V | W | X | Y | Z | Appendix
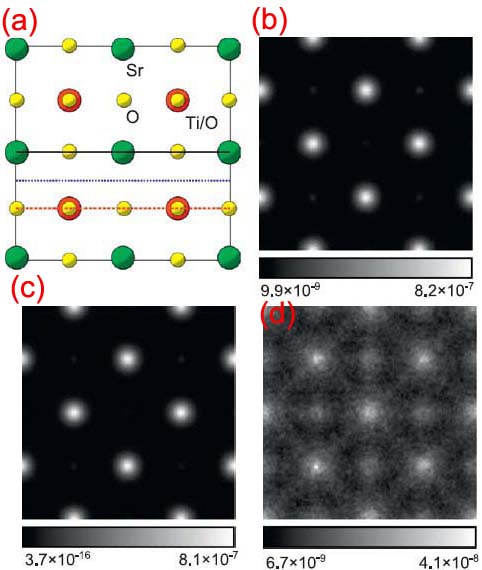
| We can assume that the wave of the incident electron beam is perfectly even and coherent and the illumination electron wave is ψillum = 1. For the case of single atoms weak-phase object approximation can be assumed, and thus the exit plane wave function (or called object wave function) for an atom located at the position (αx, αy) can be given by, where, where, For the weak phase object approximation, a first order expansion may be applied to Equation 4217a and then we can have, To emphasize the physical meaning of Equation 4217c, it is sometimes divided into one part, 1, corresponding to the direct beam (ψillum) and one part related to the scattered electrons, Ψo,s [4], where Ψo,s is given by, The Fourier transform of the two-dimensional (2-D) exit wave is given by, where, Therefore, the Fourier transform of ψExit(r) gives, where, For the case of atom columns of a crystal or a particular crystal defect, in a simplified channeling theory, an expression for the exit wave of a single atom column is expressed as [1 - 3], where, All the purpose of the methods of the electron image series reconstructions with TEM is to find an object wave function, ψo,s. The reconstruction methods can be basically categorized by two groups: i) weak phase object approximation (WPOA) and more generally ii) phase object approximation (POA). In principle, the methods based on the POA give a better estimation of the object wave function, but they don’t have closed form solutions and have to be computed iteratively and thus is very time consuming. [5] On the other hand, the reconstruction methods based on WPOA are fast but the TEM imaging requires much thinner samples. Based on multislice simulation on SrTiO3 crystal structure (Figure 4217 (a)), Forbes et al. obtained the exit surface intensities with the total electron intensity, the elastically scattered electron intensity and the thermally scattered electron intensity. The simulation was carried out on a TEM specimen in thickness of 30 nm with a 300 keV electron probe.
Figure 4217. Exit surface intensity for (a) The projected structure of SrTiO3, (b) all electrons, (c) elastically scattered electrons and (d) thermally scattered electrons.
Adapted from [6]
[1] D.Van Dyck, H. Lichte, K. D. van der Mast, Sub-angstrom structure characterisation: the Brite–Euram route towards one angstrom, Ultramicroscopy 64 (1996) 1–15.
|
 ---------------------------- [4217a]
  ---------------------------------- [4217b]
  --------------------- [4217d]
  -------------------------[4217e]
  --------------------- [4217f]
  --------------------- [4217g]
 ----------------- [4217h]