Chapter/Index: Introduction | A | B | C | D | E | F | G | H | I | J | K | L | M | N | O | P | Q | R | S | T | U | V | W | X | Y | Z | Appendix
| Table 4768. Main edges of fluorine (F) used in EELS analysis.
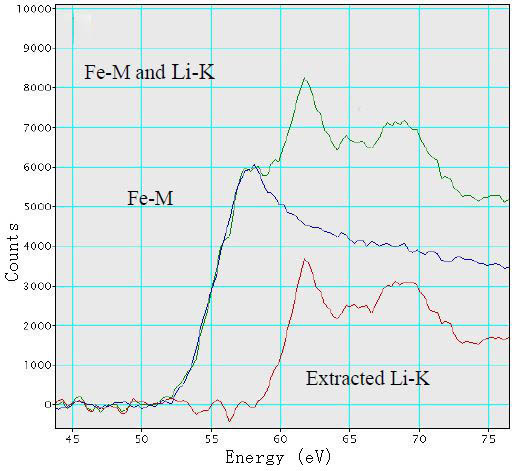
The spectra from F-K edge can be very noisy so that deconvolution is needed to reduce the noise. The deconvolution can be performed, for instance, by Pixon based method [1, 2] In this process, the corresponding low loss spectra are used as a point-response function (PRF). The restored spectra are summed with the main peak position aligned at the same energy so that the remaining statistical noise is reduced. The low loss region in Figure 4768a shows the overlap between Fe-M edge and Li-K edge in an EEL spectrum taken from discharged FeOF materials in a Li-ion battery. The extracted Li-K edge was obtained by deconvolution technique.
Figure 4768b shows energy-loss spectrum of an iron fluoride film (FeF2), taken with TEM-EELS system.
Figure 4768c shows the measured CeF3 F-K ELNES. [4] The main structure width, including the large peak A and its shoulder B, was evaluated as the distance between the positions of the broken lines corresponding to the minimum and maximum in the second differentiated spectra.
Figure 4768c. The measured CeF3 F-K ELNES. Adapted from [4] Figure 4768d shows the unoccupied partial density of states (PDOS) of CeF3 and the bond overlap population diagram (BOPD) between Ce and its neighboring F for the non-core-holed, ground state electronic structures. The main peak structures of the ELNES in Figure 4768c correspond to the Ce5d derived states, which range from 5 to 9 eV above the Fermi level (the Fermi level in Figure 4768d is set to zero). Since the intensities of the BOPD are negative, the corresponding interactions between the Ce and anion F atoms are all antibonding. Larger BOPD intensities correspond to larger spatial overlaps between the two molecular orbitals, promoting higher antibonding energy levels. [5] The spatial overlaps between the Ce5d and the F orbitals show a variation in the Ce5d-derived states, resulting in the energy width of Ce5d PDOS and the main peak structures in the ELNES in Figure 4768c.
[1] S. Muto, R. C. Puetter and K. Tatsumi: J. Electron Microscopy 55
(2006) 215–223.
|