Chapter/Index: Introduction | A | B | C | D | E | F | G | H | I | J | K | L | M | N | O | P | Q | R | S | T | U | V | W | X | Y | Z | Appendix
| Peak overlapping occurs often in EDS profiles, for instance, it is especially a severe problem in the analysis of soft X rays such as some K-peaks of light elements (Z< 10), the L-peaks from transition metals, and the M-peaks from the rare earths. This overlapping occurs within the energy resolution of EDS system. On the other hand, some small peaks are formed due to peak overlapping or due to the sum of two or more lower energy peaks. The EDS profile of BaTiO3 system shown in Figure 4634a presents an example of EDS peak overlap. However, the FWHM of the WDS peaks is only a few eV because the energy resolution of the wavelength spectrometer is 5-10 eV. In this case, peak overlap in WDS is not a problem.
Figure 4634b shows the comparison between EDS and WDS for WSix alloy. The EDS spectrum in red shows a single peak with a Full-Width Half-Maximum (FWHM) of 260 eV, while the WDS with higher energy resolution in green reveals the presence of both tungsten and silicon (FWHM: < 40 eV).
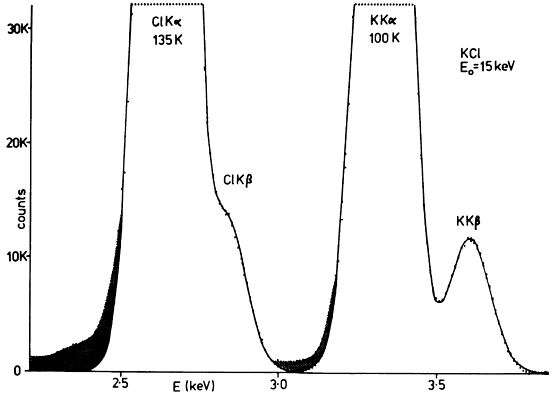
Figure 4634b. Comparison between EDS and WDS for WSix alloy. The EDS spectrum of KCl in Figure 4634c shows a peak overlap and a typical spectrum distortion induced by the incomplete charge collection. The chlorine Kα and Kβ peaks are not resolved, while the potassium Kα and Kβ are almost resolved. The solid line is a Gaussian fit to the data points. The shaded areas are two non-Gaussian low energy tails that are distortions induced by incomplete charge collection.
To measure the intensity of an X-ray line, the line must be separated from other lines and from the continuum background. The separation relies on accurate modeling of the shape of individual peaks. Furthermore, we need to be aware of the original characteristic x-ray peaks from the EM sample probably overlapping sum peaks and escape peaks. For instance, Figure 4634d shows the schematic illustration of dependence of sum peak intensities on different dead times. This figure indicates that we need to minimize the dead time in order to minimize the intensity of the sum peak.
Figure 4634d. Schematic illustration of dependence of sum peak intensities on different dead times. In general, EDS has poor energy resolution of the peaks. The widths of X-ray peaks in EDS measurements are determined by the energy resolution of the detector, but not by the atoms in the specimen. A typical EDS peak is about 100 times the natural peak width, which is limited by the statistics of electron-hole pair production and electronic noise, resulting in severe peak overlaps. There are mainly two classes of typical problems that are caused by peak overlaps: In comparison between EDS measurements of low- and high-energy incident electron beams, the low-energy method has the disadvantage of reducing the number of peaks in the spectrum that can be excited by the incident beam. Therefore, there are a number of peaks at these low energies and thus these peaks overlap, resulting in inaccurate elemental identification and quantification. However, For EDS measurements with high-energy beams, peak overlap may not be a critical problem so that the position and intensity of the high energy peaks can allow more accurate identification and quantification. Table 4634 list some peak-overlaps which happen quite often and thus are often misidentified, and the full list for all the elements in periodic table can be found at excel file. Table 4634. Example of peak-overlaps in EDS.
|