Chapter/Index: Introduction | A | B | C | D | E | F | G | H | I | J | K | L | M | N | O | P | Q | R | S | T | U | V | W | X | Y | Z | Appendix
| Since the old age of microscopes (mainly optical microscopes, of course), the researchers had investigated and answered the question of which factors determine the spatial resolutions. The resolution for light microscope is defined by Rayleigh criterion, δ = 0.61λ/μ sinβ ------------------------- [4459a] where, In a TEM, only very small scattering angles are included so that sinβ ≈ β. this criterion can be approximated by, δ = 0.61λ/β ------------------------- [4459b] where, However, an actual TEM will never approach this resolution limit because of lens aberrations.
Furthermore, a shorter focal length of objective lens provides smaller spherical aberration and higher spatial resolution, while a longer focal length gives higher image contrast.
Thon rings are a phenomenon revealed in the power spectra of micrographs by bright-field (BF) TEM (transmission electron microscopy) imaging. These rings can be explained as the effect of the contrast transfer function, which modulates the Fourier transform of the object in a defocus-dependent way. Figure 4459a (A) shows the power spectrum of a typical BF TEM image of amorphous carbon film presenting concentric Thon rings. Those white rings correspond to the contrast transfer maxima and the dark rings indicate spatial frequency bands without signal. Figure 4459a (B) shows the radial intensity of the power spectra. The astigmatism and defocus can affect the symmetry of the rings, limiting the spatial resolution of the microscope. Therefore, electron micrographs, especially HRTEM, are routinely inspected by optical diffraction before taking images for analysis.
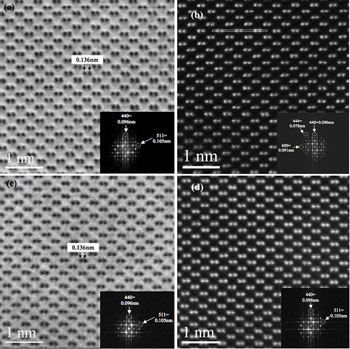
JEM-ARM 200F, a modern TEM, has been integrated with aberration correction into a super-shielded electron column that safeguards the ultrahigh-powered optics from environmental interferences. The completely new electron column design in this type of microscopes provides atomic spatial energy resolution as well as high probe currents, enabling both atom-by-atom imaging resolution and unmatched spatial resolution for atom-to-atom chemical mapping of materials, including EDS and EELS. Figure 4459b shows the resolved Si (silicon) structures by UT-SA JEOL JEM-ARM 200F. Figure 4459b (b) demonstrates that HAADF image gave at least 78 picometer spatial resolution. Clearly, these high resolution microscopes can be used for sub-atomic research.
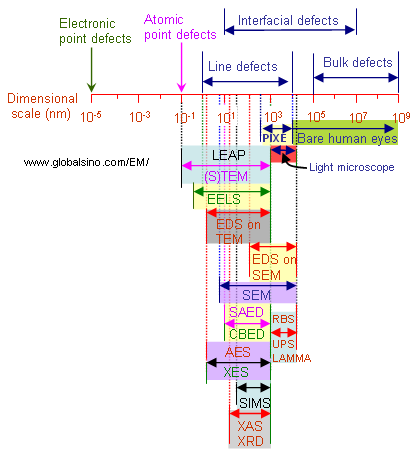
The spatial resolutions of EELS/EFTEM can be slightly worse than those of HAADF and TEM imagings primarily due to the specimen drifts during the slower acquisitions of the spectra or elemental mapping. For the TEM configuration with a top-entry type EDS detector, the detector is placed above the objective lens in a TEM system with a high viewing angle (e.g. 70 °) to a horizontal specimen. Since the detector takes X-ray signals from the top of the objective lens, a large bore polepiece for the objective lens is needed. The use of such polepieces degrades the spatial resolution as well as the probe size. Figure 4459c shows the typical sizes of various material defects and the capability of analytical techniques (See the full names of the techniques at page3928). The lowest levels of the techniques represent their spatial resolutions.
Table 4459. Example of resolutions in HRTEM mode.
|