Chapter/Index: Introduction | A | B | C | D | E | F | G | H | I | J | K | L | M | N | O | P | Q | R | S | T | U | V | W | X | Y | Z | Appendix
| In the analytical techniques based on X-rays, e.g. EDS, the smallest detectable elemental concentration and the minimum number of detectable atoms, which correspond to the smallest X-ray signal that can be measured above the background, are usually defined as the minimum mass fraction (MMF) and the minimum detectable mass (MDM), respectively. For instance, the sensitivities of analytical techniques are determined by the minimum detectable limit or minimum mass fraction (MMF). Generally EELS (Electron Energy Loss Spectroscopy) has better sensitivity than EDS (Energy-dispersive X-ray spectroscopy), due to the potential of utilizing signals generated from larger ionization cross sections (L rather than K) and the much greater collection efficiency. [1 - 2] The sensitivity of X-ray detection corresponds to the detection of the smallest obvious X-ray signal above the spectrum background. The X-ray counting statistics obey Gaussian behavior. It can be considered that a peak containing IA counts (intensity) is real if it is larger than three standard deviations of the background, given by, where IAb is the background intensity for element A. In the absence of peak interference (peak overlap), the MMF can be given by, where, Equation 4792b indicates that any of the three factors IPA, IPA/IbA, or τ can be increased to improve the MMF.
Another term to describe the detection limitation is minimum detectable mass (MDM), which is given by, [3] Similar to EELS, the peak-to-background ratio (P/B ratio) in EDS increase with accelerating voltage. In general, Figure 4792a shows the behavior of peak-to-background ratio and minimum mass fraction (detection limit) as a function of overvoltage. In order to be able to detect minor elements, the overvoltage must be not less than 2, while the overvoltage should be much bigger if the detection of trace elements is needed.
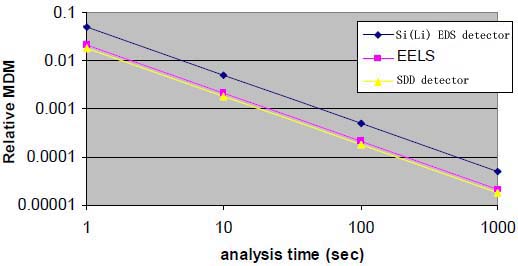
For very thin TEM films, low accelerating voltage electron beams can enhance the sensitivity of EDS measurements (similar to EELS technique) because the reduced the acceleration voltage increases the ionization cross-section, which is also determined by the overvoltage ratio. The MDM can also be evaluated by [5], and, where, I+Ais not adjustable for improving the MDM because it is constant for a given element (A) and a specific detector, but τ and J can be increased to obtain better MDM. For instance, for EDS detection of ferritin molecules in certain experimental conditions with a 100 sec collection time [6], at a low probe current the minimum detectable mass was about 2.3 x 10⁻¹⁹ g, while at the maximum available probe current of 1.0 nA, the minimum detectable mass was reduced to 0.9 x 10⁻¹⁹ g. In general, it is very common that the MDM is ~10-20 g for the range of Z (atomic number) from 10 to 40. Figure 4792b shows the comparison of the relative MDMs, obtained from 50 nm SrTiO3 TEM specimen, versus analysis time t by EDS with a Si(Li) detector and a large SDD detector, and by EELS. This SDD detector had a total active area of 120 mm2, [4] resulting in even better MDM than that of EELS. Furthermore, in general, the techniques are more sensitive to the elements if the detection time is longer.
Figure 4792c shows the SEM-EDS lower limits of detection (LLD) of Cr and Fe in glass (oxide) as a function of spectrum acquisition time. The detection limits can be improved at the beginning of increasing acquisition time but cannot do with further time increase.
For TEMs with thermionic electron sources, the MDM (minimum detectable mass) of EDS measurements is in the range of 10-19 to 10-20 g, equivalent to ~100 - ~1000 atoms thick of iron (Fe). For TEMs with FEGs (field emission guns), it is possible to detect a few atoms thick with EDS technique. Finally, the detection limit depends on so many factors such as the count rate, beam current and counting time. It is important to summarize: Figure 4792d shows the detection limits attainable for EDS measurements with both Be-window and windowless detectors. For low atomic numbers, the windowless EDS provides higher sensitivity, while the sensitivities for elements with high atomic numbers are the same for both detectors.
The bremsstrahlung background is caused by decelerating the primary electrons. This background continuum makes it unable to detect characteristic X-rays from components below the 0.1-0.05% level. Even though trace elements down to ~500 ppm of oxides can be detected by SEM-EDS, their quantification is not accurate. In summary, EDS sensitivity (detection limit) can be improved in different ways: Table 4792. Summary of EDS sensitivities in different cases.
[1] M. Isaacson, D. Johnson, Ultramicroscopy 1 (1975) 33.
|
 ---------------------------------- [4792b]
 ----------------------------------- [4792d]